


Most Singapore investors watch price indices the way others watch the stock ticker, assuming one number tells the full story. It doesn’t. Singapore’s property market is layered, shaped by supply pipelines, seasonal launch cycles, cooling measures, and micro-segment dynamics that a single headline figure will never capture. If you’ve ever made a property decision based only on “prices went up this quarter,” you may have been working with a fraction of the picture. This guide breaks down what real property market analysis involves and how you can use it to make sharper, better-timed investment decisions.
Table of Contents
- What is property market analysis?
- Core data types: Price indices, volumes, and pipeline
- Reading between the lines: When market signals diverge
- Applying property market analysis to your investments
- What most investors get wrong about market analysis
- Get expert help for your next Singapore property investment
- Frequently asked questions
Key Takeaways
| Point | Details |
|---|---|
| Go beyond price trends | Relying solely on price indices can mislead; combine them with other data for true insight. |
| Understand market signals | Interpreting volume and supply trends explains moves headline prices miss. |
| Spot divergence events | Diverging data points often flag turning points or hidden opportunities. |
| Apply analysis to strategy | Use all data layers to choose the right time and asset for your goals. |
What is property market analysis?
Property market analysis is the process of gathering, interpreting, and applying data about a property market to make informed buying, selling, or investment decisions. It is not simply tracking whether prices rose or fell. For investors in Singapore, market analysis in Singapore real estate typically involves reading price indices alongside transaction volumes, new launch data, rental trends, and expert commentary to form a complete view of the market.
The foundation of any solid analysis rests on official sources. According to ERA’s latest market review, empirical market analysis is usually grounded in official or widely cited market statistics such as URA private residential price indices and transaction volumes, then interpreted through expert frameworks and market commentary.
Here is what property market analysis typically covers:
- Price indices: Track overall price movements across private residential and HDB segments
- Transaction volumes: Count how many deals are completed in a given period
- New launch data: Reveal developer activity, pricing benchmarks, and buyer sentiment
- Supply pipeline: Show upcoming completions and potential oversupply or shortfall situations
- Rental and yield trends: Offer clues about demand from tenants and returns for landlords
- Policy environment: Cooling measures, ABSD (Additional Buyer’s Stamp Duty) changes, and financing rules all shape buyer behavior
“True market analysis means synthesizing multiple data points into a coherent view of where demand, supply, and pricing are heading. Reading only one indicator is like navigating with half a map.”
This matters enormously if you are timing an entry into a new launch, deciding whether to upgrade your HDB flat to a private property, or building a multi-property portfolio. The cost of misreading the market is real, sometimes measured in hundreds of thousands of dollars.
Core data types: Price indices, volumes, and pipeline
Understanding what data to look at is step one. Understanding why each type of data matters, and where it falls short on its own, is where most investors gain an actual edge.
Price indices are the most visible metric. The URA Private Residential Property Price Index (PPI) tracks quarterly price changes across the private market. It is an excellent tool for identifying long-term directional trends, like the sustained price climb seen across 2021 to 2023. However, the PPI is a lagging indicator. It tells you what already happened, not what is about to happen. A quarter of flat price growth may feel neutral but could mask very different stories in the Core Central Region (CCR) versus the Outside Central Region (OCR).

Transaction volumes are often the unsung hero of market analysis. When volumes are high, it signals active buyer participation and confidence. When volumes drop sharply, even while prices hold steady, it usually signals one of two things: either buyers are stepping back, or there simply isn’t enough new supply hitting the market to transact. ERA’s 1Q 2026 review confirmed that quarter-to-quarter movements in price indices alongside transaction-volume swings are standard practice in market analysis, with seasonality and launch pipeline constraints cited as regular explanatory factors.
Supply pipeline is the forward-looking piece that sophisticated investors prioritize. This includes the number of units currently under construction, expected completion dates, and planned new launches. A market with strong demand but a thin pipeline is likely to see price appreciation. A market where thousands of units are completing simultaneously may face rental and resale pressure, even if current prices look strong.
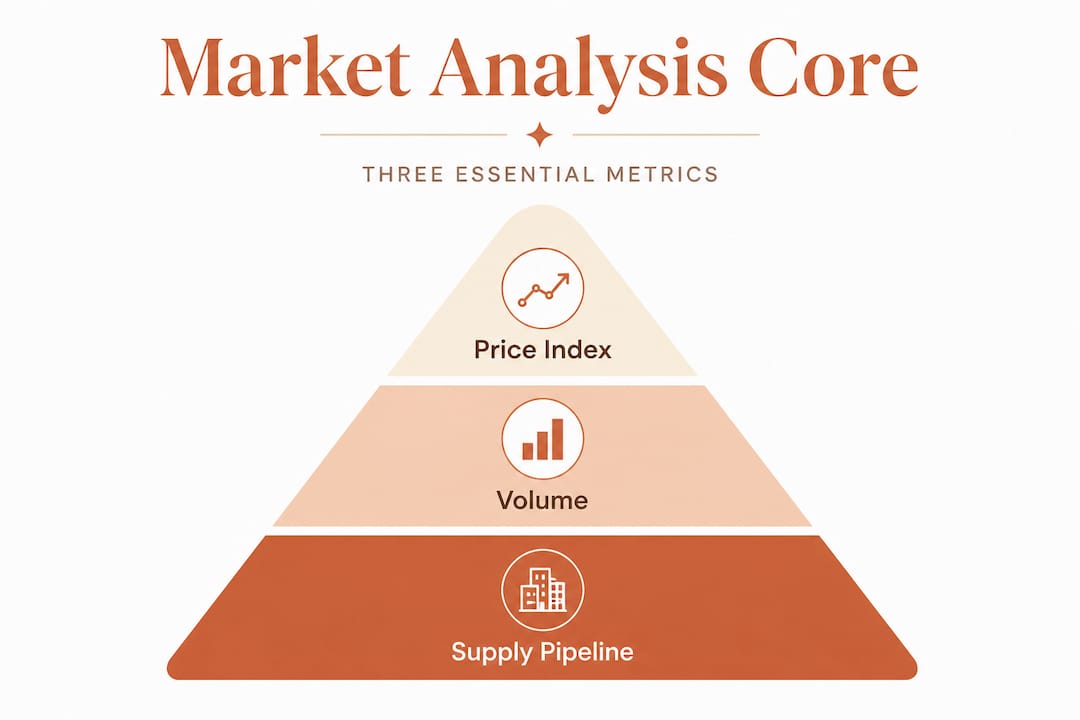
Here is a quick comparison of what each data type tells you:
| Data type | What it shows | Limitation |
|---|---|---|
| Price index (URA PPI) | Overall price direction | Lags real-time market by one quarter |
| Transaction volume | Buyer activity and deal momentum | Affected by seasonal and supply-cycle distortions |
| Supply pipeline | Future stock and completions | Delays and cancellations make forecasts uncertain |
| Rental trends | Demand from tenants, yield potential | Can diverge from capital value trends |
| New launch pricing | Developer confidence and benchmark values | High launch prices don’t always reflect resale market |
Investors looking at the Singapore price growth trajectory over the past five years will notice that volume and pipeline data often gave earlier signals than the price index alone. This is also relevant for commercial real estate market analysis, where vacancy rates and lease renewals function similarly to volume data in the residential space.
Stat to note: In 1Q 2026, private residential new launch demand stayed resilient even as overall price growth moderated, a clear example of how sub-segment data paints a very different story from the headline PPI alone.
Reading between the lines: When market signals diverge
Here is where most first-time investors get tripped up. They see two numbers that seem contradictory, like stable prices alongside falling transaction volumes, and they either panic or assume the data is wrong. Neither reaction helps.
When prices are flat or rising while transaction volumes are falling, the most common cause is a supply timing issue. If fewer new projects are launching in a given quarter, there are fewer units to transact. Prices don’t need to fall because the units that are available are still attracting buyers. It’s a demand-supply mismatch, not a signal of a market turning negative.
Seasonal effects compound this. Chinese New Year typically slows transaction activity as buyers and sellers pause. Major project launches can temporarily spike volumes in one quarter and deflate them in the next. The ERA 4Q 2025 URA Private Quarterly Report makes this explicit: transaction volumes drop sharply even when prices are stable because of supply timing, launch cycles, and seasonal effects, meaning analysis must consider both price indices and activity metrics rather than treating one alone as truth.
The table below illustrates common divergence scenarios and what they usually mean:
| Scenario | Likely explanation | Investor signal |
|---|---|---|
| Prices stable, volumes low | Limited new launches or seasonal lull | Wait for pipeline clarity before concluding demand is soft |
| Prices rising, volumes high | Strong demand, active launches | Bullish phase; assess entry timing carefully |
| Prices rising, volumes falling | Supply-led price support, weak volume | Caution; check if pipeline will expand and correct prices |
| Prices falling, volumes rising | Buyers re-entering on value; post-correction | Possible recovery phase; timing sensitive |
Looking at HDB resale market trends alongside private market data adds another layer. HDB and private markets don’t always move together. HDB resale prices held firm in periods when private transaction volumes were compressed, partly because a different buyer pool drives each segment.
Pro Tip: Never draw conclusions from a single quarter of data. Always compare year-on-year figures, check what major launches occurred during the period, and read the official commentary that accompanies each URA release. The commentary often explains why a number moved, not just that it moved.
“The market doesn’t lie, but it often misleads those who only read part of the story. Diverging signals are usually an invitation to dig deeper, not a reason to freeze.”
For a longer-range view, the property market forecast 2025-2026 reflects how analysts weigh current signals against expected pipeline releases and policy shifts, exactly the kind of multi-variable thinking every investor should practice.
Applying property market analysis to your investments
Knowing how to read the data is useful. Knowing how to act on it is what separates informed investors from reactive ones. Here is a practical, step-by-step process to apply market analysis to your actual investment decisions.
-
Start with the macro view. Pull the latest URA PPI and check whether the overall private residential market is in an expansion, consolidation, or correction phase. This gives you the backdrop against which all other decisions will be made.
-
Check transaction volumes. Look at how many deals closed in the past two to four quarters. Are volumes trending up, down, or sideways? If they are rising, buyer confidence is growing. If they are falling, understand why before reading it as a negative signal.
-
Study the pipeline. How many units are due to complete in the next 12 to 24 months in the segment you are targeting? A thin pipeline in a high-demand area is often a stronger buy signal than a rising price index alone.
-
Layer in expert commentary. ERA, Knight Frank, and other major agencies publish quarterly reports that contextualize raw numbers. Read at least two perspectives before forming a view. Disagreement between analysts is itself valuable data.
-
Match the market phase to your time horizon. A property in a rising market may suit a shorter holding period. A property in a consolidating market may require a five to seven year view to generate meaningful capital appreciation. Be honest about your own time horizon before committing.
-
Shortlist and stress-test. Once you have a target property or area, run the numbers across two scenarios: moderate growth and flat growth. If the investment still works in the flat scenario, the downside is manageable.
The ERA 4Q 2025 URA report reinforces this framework by showing that price indices and activity metrics must both be considered, with the reasons for any divergence weighed carefully. For those building a portfolio, the guide on smarter Singapore property investments extends this framework further with portfolio-level strategy.
Pro Tip: Transaction data often turns before prices do. If volumes start rising while prices are still flat, it is worth investigating whether a recovery is beginning. Some of the best entry points in Singapore’s property history were found in exactly these conditions.
What most investors get wrong about market analysis
Here is the uncomfortable truth about property market analysis in Singapore: most investors do it backwards. They read the headline, form a conclusion, and then look for data to confirm it. That is not analysis. That is storytelling with numbers.
The real skill is letting the data challenge your assumptions. When prices are strong, are volumes confirming that strength or quietly telling you something different? When a new launch sells out quickly, does that mean the whole segment is hot, or did developers simply price below market to generate buzz?
A single quarter of data is almost never enough to act on. Singapore’s property market has always had event-driven distortions, from cooling measure announcements to major project launches that temporarily inflate volumes in one district and deflate them elsewhere. Treating quarterly snapshots as gospel is one of the most common and costly mistakes new investors make.
The ERA 4Q 2025 URA Private Quarterly Report is explicit that analysis should consider both price indices and activity metrics, including the reasons for divergences, rather than treating one indicator alone as the truth of market direction. This is not just an academic point. It is the difference between chasing momentum and understanding where momentum is actually coming from.
The investors who consistently make strong property decisions in Singapore are not the ones who read the most data. They are the ones who read the right combinations of data, ask better questions about divergences, and pair their analysis with local knowledge. Understanding context, supply events, policy shifts, and buyer behavior in specific segments, is what turns raw data into an actual edge. You can build that framework by continuing to develop your Singapore market analysis skills over time.
Get expert help for your next Singapore property investment
Reading market data on your own is a great start. But even experienced investors benefit from a second perspective, especially in a market as policy-sensitive and data-rich as Singapore’s.

At Aesthetic Havens, we combine deep market intelligence with practical investment strategy to help buyers and investors make decisions they feel confident about. Whether you want to understand the fundamentals through our detailed market analysis guide, explore what real estate advisory for Singapore investors actually looks like in practice, or work directly with one of the trusted realtors in Singapore to review your portfolio or next purchase, we are here to help you move forward with clarity and purpose. Smart investing starts with smart analysis, and we are ready to walk that path with you.
Frequently asked questions
What are the main sources for property data in Singapore?
Key sources include URA price indices, transaction volumes, and regular market reports from leading agencies. The URA private residential price indices and transaction volumes form the official backbone of most market analysis in Singapore.
How often should I review property market data before investing?
Review property market data at least quarterly to capture current trends and spot major shifts. ERA’s quarterly releases confirm that quarter-to-quarter movements in price indices alongside transaction-volume swings are the standard lens for professional market interpretation.
Can I trust only price indices to judge when to buy property?
No, you should always consider price indices in combination with transaction volumes and supply factors for a fuller market view. The 4Q 2025 URA report is clear that no single indicator should be treated as the definitive truth of market direction.
What’s the biggest mistake new investors make reading the Singapore market?
Many focus on headline prices without studying transaction volumes or pipeline changes, missing key shifts in real demand. As the 4Q 2025 URA Private Quarterly Report notes, transaction volumes can drop sharply even when prices are stable, making activity metrics just as important as price data.
Recommended
- The Ultimate Guide to Smarter Singapore Property Investments in 2025 | Aesthetic Havens
- Market analysis in Singapore real estate: 3.3% price growth
- Unlocking Value: The Top 5 Undervalued Singapore Neighbourhoods for Property Investment in 2025 | Aesthetic Havens
- One Bernam: Smart Investment in Singapore Prime District


