

Most buyers in Singapore form opinions about property based on what their friends say or what they saw in last week’s headlines. That is a costly mistake. Real estate decisions backed by actual data, drawn from sources like URA quarterly reports, ERA research, and independent consultancies, consistently outperform decisions made on gut feel or anecdote. Private residential prices rose 3.3% in 2025, and the regions that drove that growth were not the ones most people were talking about at dinner parties. This guide breaks down how market analysis actually works, what to track, and how to use it to make sharper property decisions in Singapore.
Table of Contents
- Why market analysis matters in Singapore real estate
- Core methodologies: How market analysis works in Singapore
- Key data points: What to track for smarter investments
- How market analysis guides timing, pricing, and location decisions
- Expert nuances: Policy effects, seasonal trends, and triangulating insights
- Our take: Why most people still underutilize market analysis (and how to do better)
- Ready to make smarter property moves in Singapore?
- Frequently asked questions
Key Takeaways
| Point | Details |
|---|---|
| Objective data wins | Using URA statistics and professional analysis gives you a competitive edge over hearsay or assumptions. |
| Methodology matters | Analyzing supply, demand, pricing, and policies reveals market direction and investment risks. |
| Metric selection is key | Focusing on property price index, transaction volumes, and regional performance uncovers real opportunities. |
| Nuances bring clarity | Factoring in government policy effects, seasonality, and triangulated data sharpens your decisions. |
| Smart action steps | Applying market analysis helps time purchases, negotiate better, and select outperforming regions. |
Why market analysis matters in Singapore real estate
Market analysis, at its core, means using objective data to understand what a property market is doing and where it is headed. It is not reading a property blog or asking your colleague who bought a condo three years ago. It is structured, repeatable, and grounded in verifiable numbers.
One of the biggest myths in Singapore real estate is that scanning recent sales in a district gives you enough information to make a sound decision. It does not. Recent sales tell you what happened, not why it happened or what comes next. True market analysis factors in supply pipelines, policy changes, rental demand, and regional segmentation, all at once.
“Market analysis in Singapore real estate primarily relies on official URA quarterly statistics, including the Property Price Index, transaction volumes, unsold inventory, and rental indices.”
The data tells a clearer story when you know where to look. In 2025, the Outside Central Region showed the strongest price growth among the three market segments, outpacing both the Core Central Region and Rest of Central Region. That is not something you would know from reading headlines. It is what the property market forecast data reveals when you track segment performance quarter by quarter.
So why does this matter for you as a buyer or investor? Because the difference between overpaying and buying smart is almost always information. Market analysis answers the questions that protect your money:
- Is supply increasing faster than demand in this area?
- Are prices in this segment near a cyclical peak or a floor?
- Which regions are being driven by genuine occupier demand versus speculative buying?
- How has rental yield moved relative to capital appreciation?
- What policy changes are likely to affect this buyer profile?
Without structured analysis, you are guessing. With it, you are making informed decisions that hold up over time.
Core methodologies: How market analysis works in Singapore
Now that we have established why analysis is so important, let us look at exactly how experts and savvy buyers break down the market for actionable insights.
The Singapore market has well-defined data infrastructure. Analysts primarily work with URA statistics, segmented by region (CCR, RCR, OCR), property type (landed, non-landed, executive condominiums), and tenure. Supply and demand dynamics, including new launches, unsold inventory levels, and upcoming completions, form the backbone of any credible analysis.
Here is a snapshot of the core URA metrics analysts track each quarter:
| Metric | What it measures | Why it matters |
|---|---|---|
| Property Price Index (PPI) | Overall price movement | Tracks market direction |
| Transaction volume | Number of caveats lodged | Signals buyer confidence |
| Unsold inventory | Units launched but not sold | Indicates supply pressure |
| Rental index | Rental price movement | Reflects yield environment |
| New launch take-up rate | Speed of absorption | Shows demand strength |
The process for conducting a proper analysis follows a logical sequence:
- Gather raw data from URA’s quarterly report, ERA research, and supplementary reports from JLL or Cushman and Wakefield.
- Segment by region and property type so you are comparing like for like, not averaging across wildly different markets.
- Adjust for economic and policy context, including interest rate trends, ABSD rate structures, and upcoming GLS (Government Land Sales) sites.
- Synthesize trends across supply, demand, pricing, and rentals to form a directional view.
Tracking the launch pipeline analysis alongside new launch trends is especially valuable because upcoming supply often telegraphs where pricing pressure will emerge months before it shows in the PPI.
Pro Tip: Always triangulate URA data with ERA and JLL commentary. Each source brings a slightly different lens, and the overlap is where the most reliable signals live.
Key data points: What to track for smarter investments
Understanding the methodology is just step one. Let us get practical by identifying which numbers and trends truly matter for your investment strategy.
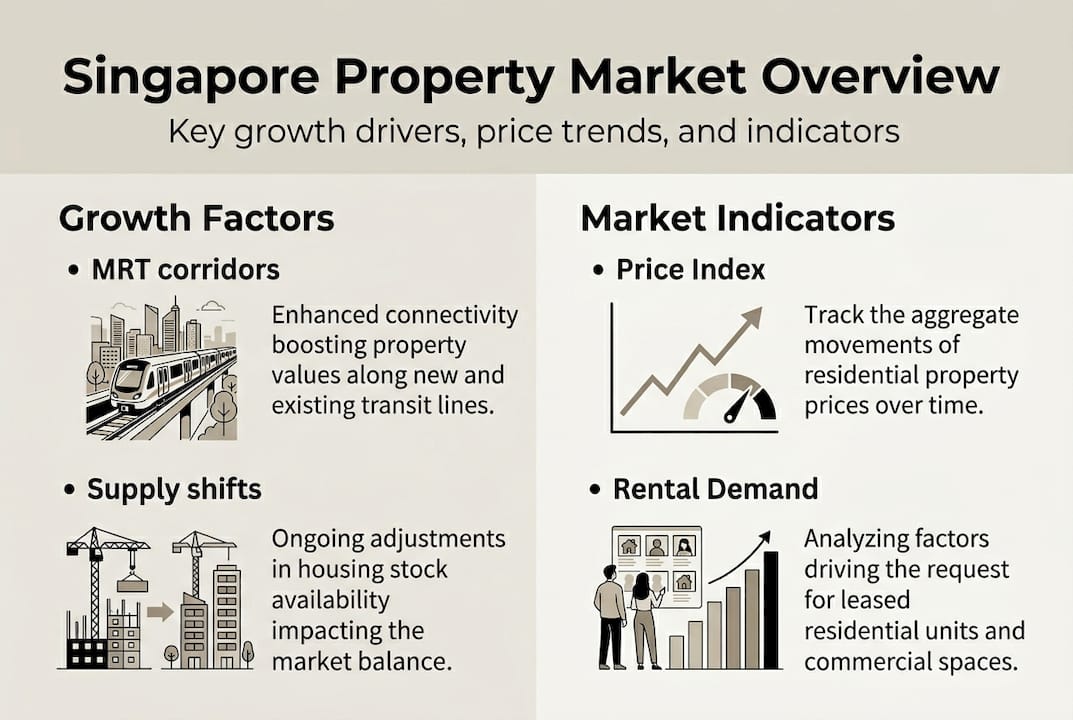
The PPI, transaction volumes, rental indices, and regional breakdowns are the four pillars of any Singapore property analysis. Each one tells a different part of the story.
![]()
Here is how the segments stacked up recently across key metrics:
| Segment | Price trend | Typical rental yield | Inventory outlook |
|---|---|---|---|
| CCR (Core Central Region) | Softening | 2.5% to 3.2% | Elevated |
| RCR (Rest of Central Region) | Stable | 3.0% to 3.8% | Moderate |
| OCR (Outside Central Region) | Rising | 3.5% to 4.2% | Tight |
| Landed | Resilient | Lower (capital play) | Very limited |
What each metric signals in practice:
- Rising PPI in a segment means buyers are competing and negotiation room is shrinking. Act sooner or wait for a correction.
- High unsold inventory in a specific region signals developer price pressure, which creates buyer leverage.
- Strong rental index growth suggests real occupier demand, which underpins capital values even through rate cycles.
- Falling transaction volumes can mean buyers are on the sidelines, often creating a window before prices adjust downward.
For investors exploring undervalued neighborhoods, the combination of tight inventory and rising rental demand in OCR has historically been a reliable early signal.
Pro Tip: Watch supply shocks closely. A large GLS release or a cluster of new launches in a single quarter can suppress pricing for 12 to 18 months in that micromarket. Timing around these events matters enormously.
How market analysis guides timing, pricing, and location decisions
Equipped with the right metrics, let us see how market analysis actively impacts your buying, selling, and investing decisions.
The application of analysis follows a four-step framework that applies whether you are buying your first home or expanding a portfolio:
- Time your entry by watching price and rental cycles. When rental yields compress and prices accelerate together, the cycle is likely near a peak. When yields expand and price growth stalls, that is often a value window.
- Use comparables for negotiation. If CCR transaction volumes are down and unsold inventory is climbing, you have data to justify a lower offer. Sellers respond to facts, not feelings.
- Select locations based on real demand drivers, not reputation. OCR growth has outpaced CCR in recent cycles because genuine owner-occupier demand is concentrated there.
- Navigate ABSD and TDSR changes with current policy awareness. These rules directly affect affordability and buyer profiles in each segment.
“Market analysis informs timing purchases, assessing value via comparables, forecasting price and rental trends, navigating policies like ABSD and TDSR, and selecting regions based on demand drivers.”
For 2026, analysts project continued OCR resilience with moderate CCR softening. If you are considering entry into a softer CCR project, the comparable data can sharpen your negotiation position significantly. Reviewing smarter investment tips alongside current HDB resale price forecasts gives you a more complete picture of upgrade pathways and entry points.
The most common pitfall is buying during peak launch momentum when marketing hype inflates perceived demand. Analysis cuts through that noise.
Expert nuances: Policy effects, seasonal trends, and triangulating insights
Beyond the must-watch numbers, top investors integrate policy, timing, and multiple data sources for a competitive edge.
Singapore’s government actively uses policy tools to prevent speculative excess. ABSD rates for foreign buyers and second-property purchases are deliberately high to keep demand owner-occupier focused. TDSR limits over-leveraging. Policy calibration prevents speculation and keeps the market structurally sound, but it also means demand composition shifts meaningfully whenever rates change. Analysts who track these shifts gain early visibility into which buyer segments will drive the next phase of activity.
Seasonal effects are real and often underappreciated:
- Year-end slowdowns (November to January) typically reduce transaction volumes as buyers defer decisions. This creates brief windows of seller motivation.
- Q1 launch clusters often generate artificial momentum because developers front-load releases. Strong take-up early in the year can mask underlying demand softness later.
- School registration seasons quietly lift demand in specific OCR zones with premium primary school catchments.
- GLS tender outcomes published mid-year telegraph future supply 18 to 36 months out, giving analysts time to position before the market adjusts.
“Sub-sale rates in Singapore remain low relative to regional peers, confirming that owner-occupier demand rather than speculative flipping drives the market’s core stability.”
Do not rely on a single data source. URA provides the raw numbers. ERA and JLL add transactional context. Cushman and Wakefield bring a cross-market perspective. Used together, they eliminate blind spots. Tracking rental market insights alongside capital value trends is particularly valuable for investors managing yield-versus-growth trade-offs.
Our take: Why most people still underutilize market analysis (and how to do better)
Here is an uncomfortable truth: most buyers, even experienced ones, do not really use market analysis. They use market anecdotes. There is a big difference.
Anecdotes are stories someone told you about a unit that sold well. Analysis is a quarterly review of PPI movement, unsold inventory by segment, and rental trend data, followed by a clear investment thesis. The former feels informative. The latter actually is.
The most consistent blind spot we see is buyers ignoring regional segmentation and policy timing together. Someone buys into CCR because it “always bounces back” without checking that inventory is elevated and ABSD has dampened foreign demand. That is not investing. That is hoping.
Our recommendation: make data-tracking a quarterly habit. Every three months, review URA’s release and ask yourself which region is outperforming, which is lagging, and why. Then check whether your thesis from the previous quarter still holds. That discipline, applied consistently through advanced investment frameworks, is what separates investors who build wealth through property from those who just own property.
Pro Tip: The most durable gains in Singapore real estate come from sustainable demand drivers like MRT expansion corridors and top primary school catchments, not from chasing “hot” launches.
Ready to make smarter property moves in Singapore?
Putting these insights into practice is easier when you partner with seasoned pros who track the market daily.
Understanding market analysis gives you an edge. Applying it with expert support makes it decisive. The agent services benefits available through Aesthetic Havens connect you with advisors who read URA data every quarter and translate it into practical, personalized guidance for your specific goals.

Whether you are buying your first home, expanding a portfolio, or exploring investing in commercial property, the right guidance changes outcomes. Visit Aesthetic Havens to explore property insights, browse listings, and connect with a trusted Singapore realtor who can put this analysis to work for you today.
Frequently asked questions
What is the primary source for Singapore real estate market data?
The main source is official URA quarterly statistics, including the property price index, transaction volumes, and rental trends. Independent firms like ERA, JLL, and Cushman and Wakefield provide supplementary commentary that adds valuable transactional context.
How can market analysis help home buyers time their purchase?
Market analysis informs timing by revealing demand-supply cycles, price dips, and high-growth regions so buyers can enter markets with better value and lower risk. It removes the guesswork that leads most buyers to buy at or near cycle peaks.
Which market indicators should property investors track?
Investors should monitor PPI, transaction volumes, rental indices, unsold inventory, and region-specific trends each quarter for the most complete picture. Together, these metrics signal whether a segment is heating up, cooling off, or consolidating.
How do government policies affect Singapore property market trends?
Policies like ABSD and TDSR stabilize prices, limit speculation, and directly influence demand across different buyer profiles. Any change to these tools tends to shift transaction volumes and pricing dynamics within one to two quarters.
Recommended
- Singapore HDB Resale Market Deep Dive (H2 2025): Top Estates & Price Forecasts | Aesthetic Havens
- Unlocking Value: The Top 5 Undervalued Singapore Neighbourhoods for Property Investment in 2025 | Aesthetic Havens
- Singapore Commercial Property Trends: Opportunities for 2026
- Guide to Singapore Mortgages & Property Affordability in 2025 | Aesthetic Havens
- Optimisez votre analyse de la performance immobilière en 2026
