

Introduction
Between January and September 2026, developers sold approximately 5,334 private homes (excluding executive condominiums), a 30.4% decline from the same period in 2025. That headline number, however, obscures the real story. The months with large project launches saw absorption rates above 70%, while months with thin pipelines recorded near-zero new supply and modest sales drawn from existing projects. Understanding month-by-month take‑up rates, not just raw units sold, is the only reliable way to separate genuine demand shifts from launch-calendar noise.
This article covers private new launch sales in the Singapore property market from January through September 2026, with selective forward-looking notes on Q4. The scope is private residential properties, including executive condominiums where relevant; resale, commercial, and industrial segments fall outside this analysis. The Urban Redevelopment Authority provides monthly data on Singapore’s housing sales, and that dataset forms the backbone of every table and project example below. CBRE projects 7,500 to 8,500 new homes sold in 2026, suggesting the full-year picture will remain healthy barring major economic shocks.
The strongest months were January, March, and April, driven by mega outside central region launches like Tengah Garden Residences and Coastal Cabana EC. The weakest recorded months, February and June, reflect supply gaps rather than buyer retreat. After reading this article, you will be able to:
-
Calculate and interpret project-level and island-wide take‑up rates using URA data
-
Distinguish between genuine demand weakness and normal launch-calendar seasonality
-
Benchmark 2026 launches by region: outside central region OCR, rest of central region, and core central region CCR
-
Identify pricing and negotiation signals embedded in monthly developer sales patterns
-
Apply a step-by-step framework to evaluate any new launch before booking a unit
Understanding New Launch Take‑Up Rates in the Private Residential Market
Take‑up rate measures how quickly buyers absorb the units a developer puts on the market. In a city-state where new home sales are highly sensitive to project launch timing, this single metric reveals more about buyer interest than the absolute count of homes sold in any given month. Throughout this article, 2026 URA developer sales data serves as the running example set.
What Is a Take‑Up Rate for New Launches?
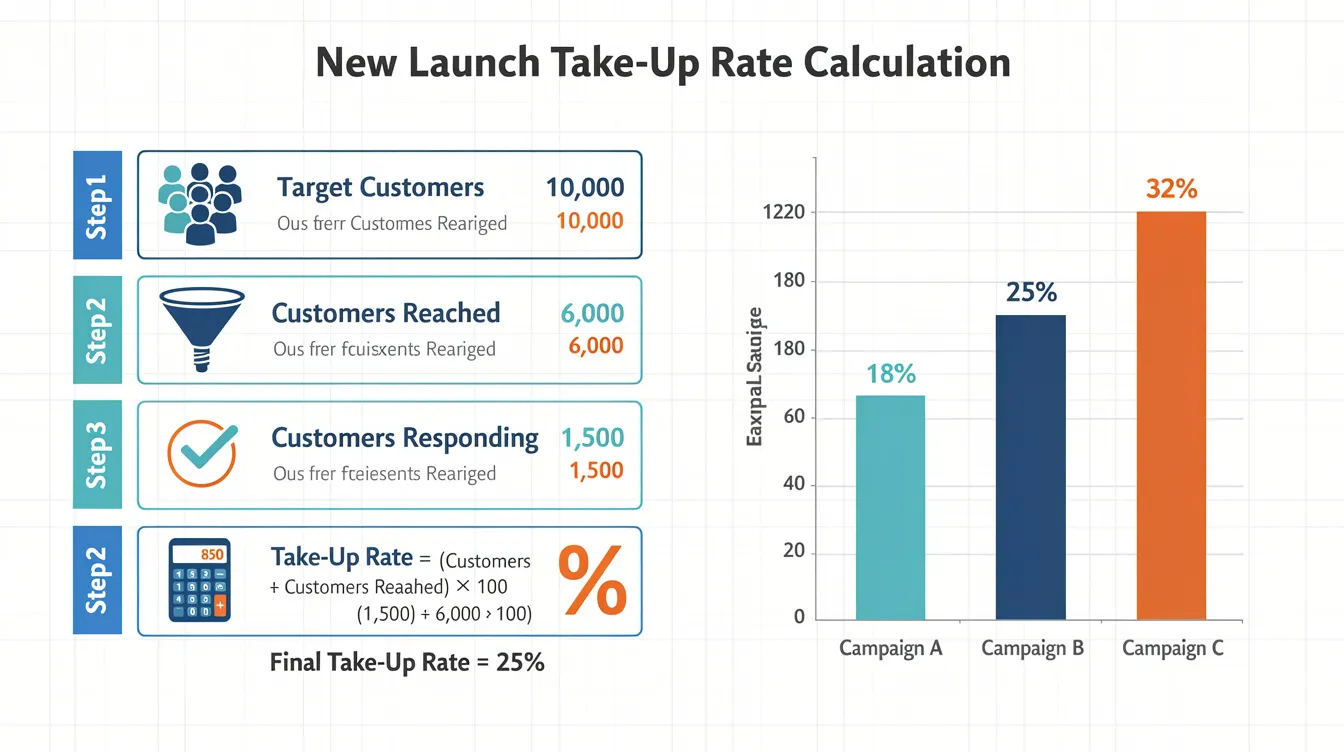
A take‑up rate is calculated as: (units sold in a project’s launch period ÷ units launched for sale) × 100%. If a developer releases 500 units and buyers snap up 350 in the launch month, the project-level take‑up rate is 70%.
Two versions of this metric circulate in market commentary, and confusing them leads to bad conclusions. Project-level take‑up divides a specific project’s sales by the units that project released; it is precise and comparable across launches. Island-wide monthly take‑up divides all private homes sold in a month by all units launched that month. The island-wide figure can exceed 100% because some sales in a given month come from units launched in prior months, not from that month’s fresh supply. In February 2026, only 15 units were launched (excluding ECs), yet 246 units sold; the implied ratio of 1,640% is arithmetically correct but analytically useless.
URA reports “units launched” and “units sold” for private residential properties excluding ECs in one dataset, and EC units in a separate track. When industry analysts say “developer sales,” they typically mean the ex-EC figure unless stated otherwise.
Why Take‑Up Rates Matter More Than Headline Sales
A month recording 1,500 units sold tells you little without knowing how many were put on the market. April 2026 saw 1,548 units sold against 1,426 launched (ex-EC); that 109% ratio indicates demand outstripped fresh supply. By contrast, June recorded 156 sales with zero new launches, making “156 units sold” a measure of inventory drawdown from existing projects, not of new-launch appetite.
Take‑up connects directly to pricing power. When a project achieves 70%+ absorption in its first launch phase, developers typically raise prices in subsequent phases by 2–5%. Tengah Garden Residences sold nearly all 863 units in its April launch month, giving its developer clear justification to hold firm on pricing for remaining stock. Conversely, Amberwood at Holland sold roughly 24 of 70 released units in September, a 34–35% take‑up that creates room for buyers to negotiate.
With that metric defined, the next section walks through how take‑up rates evolved month by month across 2026.
Singapore New Launch Sales 2026: Month‑by‑Month Overview
Sales activities in Singapore’s real estate market exhibited distinct quarterly phases in 2026. The first half was dominated by large OCR and EC debuts that pushed both launches and sales to their annual peaks. The second half saw a thinner launch calendar, with demand concentrating in mid-sized projects across the rest of central region and core central region. Months with major project launches see sharp increases in sales volumes; months without them do not.
The tables below use URA’s monthly developer sales figures plus agency estimates. All “Units Launched” and “Units Sold” columns refer to private non-landed homes excluding ECs unless marked otherwise.
Monthly Take‑Up Snapshot: January to June 2026
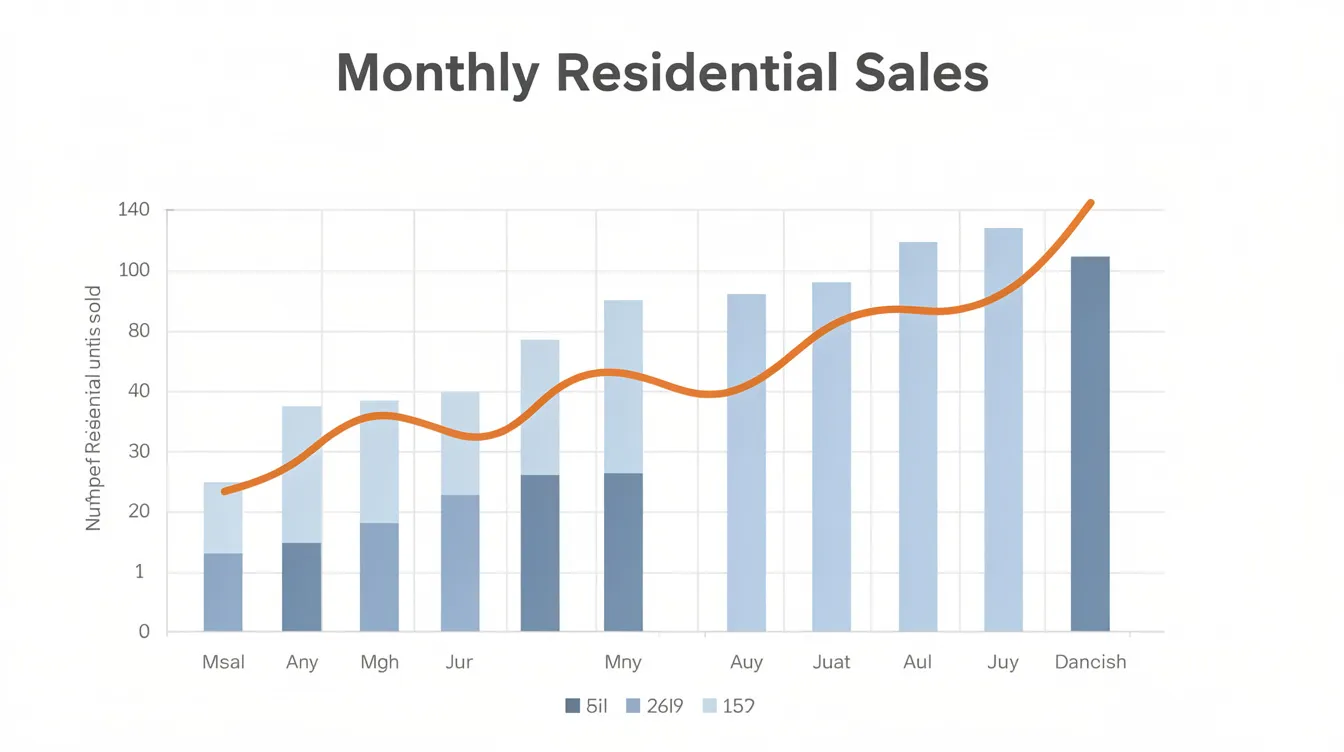
Developers sold 990 new homes in January 2026, the strongest month since October 2025. April then set the year’s high-water mark at 1,548 units sold (ex-EC), powered by Tengah Garden Residences and Vela Bay. The market experienced a dip in sales during months with zero new launches, with June recording just 156 ex-EC sales.
|
Month |
Units Launched (ex-EC) |
Units Sold (ex-EC) |
EC Units Sold |
Indicative Take‑Up (%) |
Key Projects / Notes |
|---|---|---|---|---|---|
|
Jan 2026 |
786 |
466 |
524 |
~59% |
Coastal Cabana EC sold 504 units at $1,790 psf; Newport Residences (~487 units) achieved ~42% take‑up; 67% of new private homes sold were below $2.5 million |
|
Feb 2026 |
15 |
246 |
20 |
Distorted* |
CNY lull; near-zero launches; sales drawn from prior inventory; River Modern launched after festivities |
|
Mar 2026 |
1,043 |
1,300 |
637 |
~125% |
Rivelle Tampines EC, Pinery Residences, and River Modern drove volumes; heavy OCR + RCR slate |
|
Apr 2026 |
1,426 |
1,548 |
101 |
~109% |
Tengah Garden Residences (~863 units, ~100% launch-month take‑up); Vela Bay (~515 units, ~75% take‑up) |
|
May 2026 |
357 |
447 |
46 |
~125% |
Hudson Place Residences (327 launched, 209 sold, ~64% take‑up); only two notable launches |
|
Jun 2026 |
0 |
156 |
28 |
N/A |
Zero ex-EC launches; all sales from previously launched stock; resale transactions often increase during periods without new property launches |
*February’s ratio (246 sold ÷ 15 launched) reflects almost no new supply, not extraordinary demand.
Three patterns stand out in the first half:
-
OCR-led absorption: Properties priced under S$2.5 million consistently dominate sales transactions. Tengah Garden Residences, priced at a median of ~S$2,113 psf, sold out within its launch month. Vela Bay achieved 75% take‑up. Both targeted HDB upgraders and families.
-
EC demand from first time buyers: EC sales accounted for 524 units in January 2026 alone. New EC prices are 17% lower than private condos in OCR, and in January 2026, the median price for new EC units was $1,788 psf. Demand for ECs is driven by first-time buyers and HDB upgraders, many of whom have cleared their minimum occupation period.
-
Launch scarcity inflates ratios: May and June saw healthy project-level take‑up despite modest totals. Demand continues for both new launches and existing inventory in fluctuating market conditions.
Monthly Take‑Up Snapshot: July to December 2026
The second half of 2026 opened with July’s resurgence as Lentor Gardens Residences and Dunearn House entered the market. August and September reverted to low-launch mode before a Q4 pipeline refresh.
|
Month |
Units Launched (ex-EC) |
Units Sold (ex-EC) |
EC Units Sold |
Indicative Take‑Up (%) |
Key Projects / Notes |
|---|---|---|---|---|---|
|
Jul 2026 |
889 |
731 |
27 |
~82% |
Lentor Gardens Residences (499 units, ~304 sold, ~61%); Dunearn House (380 units, ~237 sold, ~62%) |
|
Aug 2026 |
116 |
153 |
18 |
Distorted* |
Hungry Ghost Festival month; lowest launch volume after Feb; sales largely from backlog |
|
Sep 2026 |
158 |
296 |
23 |
~187%* |
Amberwood at Holland (~70 units released, ~24 sold, ~34% take‑up); 19 landed homes sold, highest since April 2018 |
|
Oct 2026 |
Est. large |
Est. strong |
TBD |
TBD |
Thomson Reserve (1,268 units) and Serra Residences (District 11 freehold) debut; contrast expected between mega-project and boutique launch |
|
Nov 2026 |
Est. moderate |
Est. moderate |
TBD |
TBD |
Stabilisation month; inventory from October launches expected to continue clearing |
|
Dec 2026 |
Est. low |
Est. modest |
TBD |
TBD |
Year-end slowdown typical; some tactical price incentives possible for lagging projects |
*August and September ratios are distorted by very low launch denominators. The 2H 2026 GLS Confirmed List includes nine new sites, which will feed future supply.
H2 interpretation points:
-
July’s two major launches both achieved ~61–62% first-month take‑up, solid for RCR/OCR fringe projects but below April’s near-total absorption. Buyer interest concentrated in projects near MRT stations and established amenities.
-
Sales trends show substantial variation influenced by festive periods and launch schedules. August’s 116-unit launch total is the calendar effect of the Hungry Ghost Festival, not a demand collapse.
-
September’s landed homes sold (19 units) marked a shift toward higher-quantum purchases. In 2026, strong buyer demand was observed for properties in prime locations, including freehold CCR sites like Amberwood, where the take up rate was lower but the purchase price per unit was high.
-
Q4 2026, led by Thomson Reserve’s 1,268 units, is expected to test whether the market can sustain April-like volumes or whether take‑up will settle at the 60–70% range typical of the second half.
Reading the Signals: What Strong or Weak Months Really Mean
Monthly developer sales data reflects three forces at once: buyer demand, developer launch strategy, and calendar seasonality. Isolating which force is dominant in any given month is the difference between a sound purchase decision and a reactive one. The US Federal Reserve cut rates by 0.25% in December 2025, and SORA dropped from 3.0% to 1.2% by late 2025, pushing local mortgage rates to three-year lows. Fixed-rate housing loans dropped from 3.1% to 1.4%–1.8% in 2026, with 80% of OCBC customers choosing fixed-rate mortgage packages recently. That rate environment underpins the resilience visible across most of 2026.
When High Monthly Take‑Up Is a True Bullish Signal
April 2026 satisfies every condition for genuine strength. Multiple mid-to-large launches all achieved above 60% first-month absorption. Tengah Garden Residences hit ~100% and Vela Bay reached ~75%, across different submarkets within the outside central region. Sales were strong even at above-market psf for the submarket; Hudson Place Residences in May achieved 64% take‑up at ~S$2,485 psf in the RCR, a price point that did not deter buyers.
Sustained strong sales in months without aggressive discounts confirm the signal. April’s absorption happened at realistic developer pricing, not fire-sale levels. For buyers and investors, a month like April means faster price steps in subsequent phases, fewer early-bird discounts, and tighter negotiation room. The best selling project in a strong month often sets the pricing benchmark for neighbouring launches in the following quarter.
When Weak Monthly Numbers Do Not Indicate a Market Downturn
February 2026 (15 units launched, 246 sold) and June (zero launches, 156 sold) look soft in raw numbers. Neither reflects a demand retreat. February’s thinness comes from Chinese New Year; housing developers delay launches because showflat traffic drops during the holiday. June was a bridge month between the April mega-launch cycle and the July pipeline restart.
CCR luxury launches with naturally smaller buyer pools also suppress monthly totals without indicating weakness. Amberwood at Holland, a freehold project in a prime district, sold 24 of 70 released units in September. That 34% take‑up is consistent with high-quantum, niche-segment projects; the average price per unit there runs well above the suburban median. Developers choosing to phase releases also affects the data. A developer holding back 200 units to test pricing appetite will suppress both the “launched” and “sold” columns for that month.
For investors tempted to “wait for a crash” based on a single soft month: May and June 2026 together recorded 603 ex-EC sales despite only 357 units launched across the two months. The underlying demand did not disappear; the fresh supply did.
What Sustained Slow Take‑Up Tells You About a Specific Project
A performing project that sells 30–40% at launch and then stalls for three to four months sends a different signal from a project that sells 30% at launch but steadily clears inventory at 5–10% per month. Persistent unsold stock beyond six months typically indicates one or more of these issues: pricing above nearby resale comparables and competing new launches; layouts that do not match family-oriented demand (too many compact units); or a location without supporting amenities or MRT connectivity.
Sustained slow take‑up creates negotiation leverage. Developers holding unsold inventory face Qualifying Certificate penalties (for foreign-owned developers) and interest carrying costs. A buyer approaching such a project in month six or seven may secure a 3–5% discount or absorption packages. The opportunity is real, but it requires separating a fundamentally flawed project from one that is simply priced for a thinner buyer pool.
Practical Framework: How to Use 2026 Take‑Up Data in Your Buying Strategy
The steps below work for owner occupiers evaluating a home purchase and for investors sizing up capital appreciation potential. They apply to both private condos and mixed use development units where residential components are included.
Step‑by‑Step: Interpreting Monthly Developer Sales Before You Book
-
Pull the data. Go to URA’s monthly developer sales releases. Download the 2026 spreadsheets covering the last three to six months. Note the columns for units launched, units sold, and median price by project.
-
Isolate your submarket. Filter by region: core central region CCR, rest of central region (city fringe), or outside central region OCR. Narrow further to the specific project names you are considering, such as Lentor Gardens Residences, Thomson Reserve, or Hudson Place Residences.
-
Compute project-level take‑up. For each shortlisted project, divide cumulative units sold since first launch by cumulative units launched for sale. A project that launched 499 units and sold 380 has a cumulative take‑up of 76%.
-
Benchmark against peers. Compare your project’s take‑up against same-region, same-price-band launches from the same quarter. If garden residences in the OCR averaged 80% take‑up and your project sits at 55%, investigate why.
-
Overlay macro context. Cross-check against the latest interest rate moves (SORA, fixed-rate packages), government land sales announcements, and any cooling measure changes. In Q2 2026, developers launched 1,783 units, down from 1,844 in the previous quarter. In Q2 2026, developers sold 2,141 private residential units, indicating sales outpaced new supply.
-
Decide your stance. “Chase momentum” if a project is absorbing fast and price steps are imminent. “Bargain hunt” if a project’s take‑up has stalled and the developer faces carrying-cost pressure. Both strategies require data, not instinct.
Comparing Project Types: OCR vs RCR vs CCR in 2026
|
Criterion |
OCR Family Launches |
RCR City Fringe Projects |
CCR Prime / CBD |
|---|---|---|---|
|
Typical first-month take‑up (2026) |
70–100% (Tengah Garden: ~100%, Vela Bay: ~75%) |
60–80% (Hudson Place Residences: ~64%, Lentor: ~61%) |
30–60% (Amberwood: ~34%) |
|
Median launch psf (2026 examples) |
~S$2,100–S$2,200 |
~S$2,400–S$2,600 |
S$3,000+ |
|
Dominant buyer profile |
HDB upgraders, families past minimum occupation period |
Upgraders and young professionals; some second residential property buyers |
High-net-worth locals, permanent residents, selective foreign buyers |
|
Entry price sensitivity |
High; 67% of OCR sales below S$2.5 million |
Moderate; quantum stretches to S$2.5–S$3.5 million |
Low volume sensitivity; buyer pool shrinks as quantum rises above S$4 million |
|
Price growth outlook |
OCR saw a 2.2% price increase in Q1 2026; strong absorption supports further increases |
Steady; overall private home prices rose by 0.5% in Q2 2026 |
Selective; freehold premium supports long-term market value but short-term capital appreciation is slower |
OCR launches in 2026 cleared inventory fastest because they matched the largest buyer segment: families with HDB flats reaching their minimum occupation period. RCR projects like Hudson Place Residences performed well when located near transport nodes but faced more selective buyers due to higher quantum. CCR freehold projects attract a smaller pool; their take‑up rates are lower at launch but cumulative absorption over 12–18 months can still reach 70–80% for well-located sites.
For business owners evaluating a second property or mixed use development near commercial clusters, RCR and fringe-CCR projects tend to offer the best balance of rental index performance and capital upside based on 2026 data.
Common Interpretation Mistakes (and How to Avoid Them)
Misreading monthly 2026 sales leads to two equally costly errors: overpaying by chasing a “hot” launch without checking fundamentals, or sitting out a sound opportunity because a single month’s headline looked weak.
Mistake 1: Treating “Units Sold” as “Units Absorbed”
Many buyers look at the monthly total of private homes sold and assume all were newly released that month. In reality, a large share of monthly sales come from units launched in prior months. In August 2026, 153 ex-EC units sold against just 116 launched. Most of those 153 sales were from July’s Lentor Gardens and Dunearn House inventory. Always compute take‑up percentage relative to units launched, and check how much unsold inventory the developer is still holding from earlier phases.
Mistake 2: Overlooking New EC Sales in Suburban Demand Analysis
EC sales accounted for 524 units in January 2026. Coastal Cabana EC sold 504 units at $1,790 psf that month. When a large EC launch absorbs hundreds of HDB upgraders, those buyers are no longer in the market for mass-market private condos. Ignoring new EC sales can make OCR private condo take‑up look weak when it is actually being cannibalized by an attractive EC alternative priced 17% below private condos in the same region. The 572-unit Rivelle Tampines EC, launched in 2026 on Tampines Street, added to this dynamic. Always review EC volumes alongside private non landed private homes data when assessing suburban demand.
Mistake 3: Reacting to a Single Weak Month
February 2026 recorded just 15 ex-EC launches and 246 sales. June recorded zero launches and 156 sales. Neither month signals a crashing private residential market. Sales trends show substantial variation influenced by festive periods and launch schedules. A three-to-six month rolling average smooths out these spikes. Compare January through April (strong) against May through June (thin) as a bloc: the combined first half still shows robust demand, with the lull driven by launch timing, not buyer withdrawal.
Mistake 4: Comparing 2026 Launch PSF to Older Resale Without Adjusting for Lease and Floor Area
New launches are priced 20% to 30% above resale properties, and the current price gap between new and resale properties is 58%. Part of that gap reflects a fresh 99-year lease versus a resale unit with 70–80 years remaining (a difference that compounds under Bala’s Curve depreciation). Part reflects harmonised floor-area rules that make newer units more space-efficient. A 2026 launch at S$2,400 psf with 95 years of lease remaining and no renovation costs (new launches typically require zero upfront renovation costs) is not directly comparable to a 2015 resale at S$1,600 psf with 88 years left and S$80,000 in renovation needed. Take‑up rates at seemingly high psf often reflect buyers who have done this math, not irrational exuberance.
Conclusion and Next Steps
Month-by-month new launch sales in 2026 are best understood through three lenses: take‑up rates (not raw unit counts), launch pipeline timing (not headline months), and segment differences across OCR, RCR, and CCR. April’s near-total absorption at Tengah Garden Residences and June’s zero-launch quiet both tell coherent stories when read through these lenses rather than as isolated data points.
Immediate next steps:
-
Download URA 2026 monthly developer sales data and compute project-level take‑up rates for your shortlisted launches using the six-step framework above
-
Benchmark each project against same-region peers; prioritise launches with 60%+ first-month take‑up and attractive pricing relative to nearby resale
-
Factor in financing: with fixed-rate housing loans at 1.4%–1.8% and new launches utilizing the Progressive Payment Scheme for financing, cash flow differs from resale properties that require immediate lump-sum payments upon purchase
-
Explore data analytics tools and digital platforms such as URA REALIS and Propwise.sg for deeper research and data analytics on historical take‑up by district
Related topics worth exploring next: the government land sales pipeline for 2H 2026 and 2027 (which determines future supply), and financing structures for investors evaluating a second property alongside industrial or commercial holdings.
Additional Resources and Visuals
This article benefits from the following visual aids:
-
Line chart: Monthly ex-EC units sold vs units launched (Jan–Sep 2026), annotated with key project launches at January (Coastal Cabana, Newport Residences), April (Tengah Garden Residences, Vela Bay), and July (Lentor Gardens Residences, Dunearn House)
-
Bar chart: Average first-month take‑up rates by region for 2026 launches: OCR (70–100%), RCR (60–80%), CCR (30–60%)
-
Infographic: How to calculate take‑up rate, using Hudson Place Residences as the worked example: 209 units sold ÷ 327 units launched = 64%
Data sources for further reading:
-
URA Real Estate Information System (REALIS): monthly developer sales, launch volumes, pipeline data, and the property price index
-
HDB InfoWEB: MOP cohort data for understanding upgrader demand feeding into 2026 new condo launches
-
CBRE Research Singapore: quarterly private residential market reports, rental market analysis, and rental index tracking
-
ERA Singapore market commentary: monthly developer sales press releases with agent-level interpretation
FAQs on Singapore New Launch Sales 2026
Which month in 2026 recorded the highest developer sales, and why? April 2026 recorded the highest ex-EC developer sales at approximately 1,548 units sold. Two mega OCR launches drove the total: Tengah Garden Residences (~863 units, ~100% launch-month take‑up at ~S$2,113 psf) and Vela Bay (~515 units, ~75% take‑up). Both projects targeted families and HDB upgraders with attractive pricing in well-connected suburban locations.
Were new launch sales in 2026 weaker than in 2025, and should I be worried? For the first nine months, developers launched ~4,790 units, down ~41.9% from the same period in 2025 (~8,247 units). Sales fell ~30.4% (~5,334 units vs ~7,669). The decline is supply-driven, not demand-driven: take‑up rates for well-positioned launches remained above 60%. CBRE projects 7,500 to 8,500 new homes sold for full-year 2026, a moderation but not a contraction.
How do I know if a 2026 launch’s take‑up rate is “good”? For OCR family/suburban projects, launch-month take‑up of 70%+ is strong; 50–70% is respectable. For RCR projects, 60–80% indicates solid demand. For CCR or freehold launches with high quantum, 30–60% at launch is within the normal range. A project below 40% at launch that still has not cleared inventory after three months may be overpriced relative to its submarket.
Do 2026 take‑up rates suggest better opportunities in new launches or resale? Resale properties offer immediate gross rental yields of 3% to 4% and immediate occupancy. New launches offer modern layouts, longer leases, and the Progressive Payment Scheme. The 58% price gap between new and resale reflects lease-tenure and product differences, not a blanket premium. In Southeast Asia’s most liquid real estate market, the choice depends on holding period, cash flow needs, and whether the buyer prioritises capital appreciation or yield. Resale transactions often increase during periods without new property launches, creating periodic opportunities in that segment.
How will 2026 take‑up trends affect prices in 2027–2028? Strong absorption of OCR and RCR launches, combined with a limited pipeline, points to price resilience in those regions, barring major economic shocks. The OCR saw a 2.2% price increase in Q1 2026, and overall private home prices rose by 0.5% in Q2 2026. CCR freehold supply remains tight; the premium for landed homes and freehold private home stock is likely to increase. Downside risk comes from potential cooling measures or rate reversals, though current fixed-rate packages at 1.4%–1.8% provide a buffer.
Can business owners use these 2026 signals when selecting mixed-use or centrally located residential investments? Yes. RCR projects near commercial nodes (River Valley Green, One-North, Paya Lebar) show 60–80% take‑up and healthy rental market demand. Business owners evaluating a second residential property for dual-key rental or employee housing can use the same take‑up benchmarks to compare entry price, rental yield, and proximity to their operations. A personalised assessment of financing (ABSD on second property, loan-to-value limits) and operational fit is advisable before committing.

