

Introduction
Strata office rental yields in Singapore follow a clear location-driven spectrum in 2026. For investors comparing strata offices across the central business district, city fringe, and suburban business hubs, the yield gap between zones reflects differences in entry prices, vacancy exposure, and tenant depth rather than a simple “higher is better” calculation. This guide focuses on strata-titled office units (individually owned within multi-tenanted buildings), not whole office buildings.
The article compares 2026 gross and net yield ranges, vacancy risk, tenant demand profiles, and practical modelling steps across all three zones. Strata office units are individually titled within multi-tenanted buildings, giving investors different risk and liquidity profiles depending on location and building grade.
The audience: SME owners, family offices, and private investors assessing strata office purchases in Singapore, plus occupiers weighing buy-versus-lease decisions. Strata offices have no Additional Buyer’s Stamp Duty in Singapore, which separates them from residential investment. They do not attract ABSD, making them accessible to a wider buyer pool without the layered stamp duties that residential properties carry, and they can also suit smaller buyers who cannot afford a whole-floor tenancy.
Headline yield bands by location in 2026: gross rental yields for commercial properties range from 3.5% to 6%. Gross yields in Singapore’s Core CBD range from 3.5% to 4.5%; city fringe properties deliver 4.0% to 5.5% gross; suburban business hubs can achieve gross rental yields up to 6.0%. Net yields across all property sectors generally run 1% to 2% lower than gross yields after expenses. Building age, grade, and lease structure influence where any given unit falls within those bands, and investors should assess not just what a tenant will pay, but whether occupiers can sustain the rent in each location.
What you will gain from this article:
-
Concrete 2026 yield ranges for strata offices by CBD, city fringe, and suburban location, with the cost assumptions behind each number.
-
How vacancy risk and tenant demand shift from CBD to fringe to decentralised hubs, and what that means for long-run income.
-
A repeatable process to stress-test yields after factoring in service charges, property tax, rent free periods, and fit out amortisation.
-
A framework to match your risk profile and use case to the right location cluster.
-
Where to get building-level data, viewings, and yield modelling support from Aesthetic Havens.
Understanding Strata Office Rental Yields in Singapore
A strata office rental yield measures the annual rental income a unit generates as a percentage of its purchase price. Gross yields use top-line rent; net yields subtract recurring costs like MCST fees, property tax, insurance, vacancy, and leasing expenses. Both are typically calculated on a per square foot basis: monthly rent per square foot multiplied by 12, divided by sale price per square foot.
Strata offices behave differently from residential property in several ways. They do not attract ABSD, but commercial properties require higher equity and shorter loan tenures. Financing terms are tighter: banks typically cap loan-to-value at 60–70% for commercial purchases versus 75% for residential. Compared to whole-office buildings, strata offices sit in fragmented ownership structures because each unit has its own title recorded on the land register, which can create thinner resale markets and less predictable MCST governance. These assets can also sit on freehold, 999-year, or other land lease terms, which affects long-term value analysis.
The figures throughout this article reflect indicative 2026 ranges drawn from recent Singapore CBD, fringe, and suburban strata transactions and leasing benchmarks. Strata office yields range from 3.5% to 6% in Singapore, with the spread driven primarily by location, building specification, and tenant quality.
Key Components of Strata Office Gross Yields
Gross rental yield is annual rent divided by purchase price, before any cost deductions. If you buy a CBD strata office unit at S$3,000 per square foot (1,000 sq ft total: S$3,000,000) and lease it at S$11 psf per month, annual rent is S$132,000. Gross yield: 4.4%.
Net rental yield subtracts the costs that erode that income. For the same unit, MCST fees at S$1.20 psf per month cost S$14,400 annually. Commercial properties incur a 10% property tax on annual value, adding roughly S$13,200. Insurance, leasing commissions, and periodic vacancy (say one month every three years, annualised at S$11,000) push total deductions to approximately S$42,000. Net income drops to S$90,000; net yield falls to 3.0%.
Stabilised yield differs from year-one yield. In year one, rent free periods (typically one to two months on a new lease), marketing downtime, and tenant fit-out contributions reduce effective income. Stabilised yield assumes a mature, occupied lease with predictable cash flow. In 2026, net yields are often 0.8 to 1.5 percentage points lower than gross once all recurring costs are included.
The three location clusters used throughout this comparison are defined below.
Central Business District (CBD) vs City Fringe vs Suburban Business Hubs: How We Define Locations
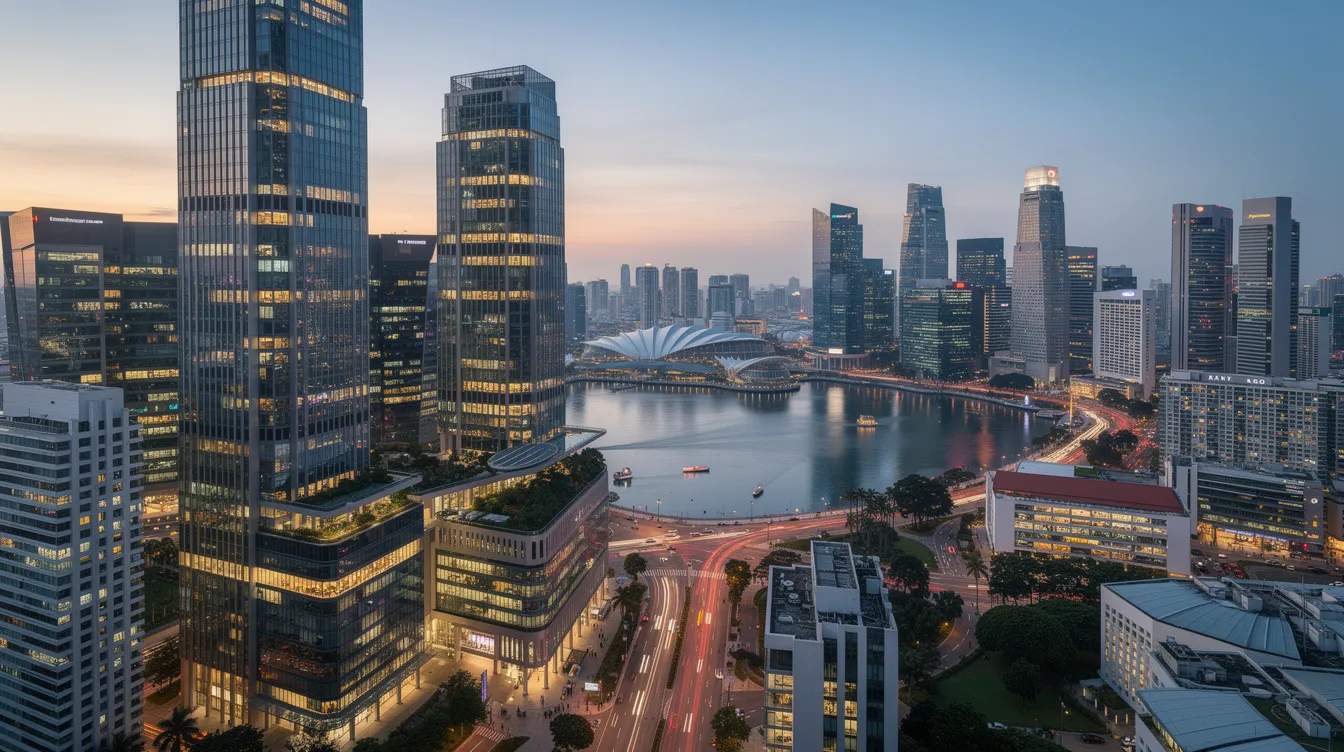
CBD strata office refers to units in the core central business district and Downtown area: Raffles Place, Marina Bay, Tanjong Pagar, Shenton Way/Robinson Road, and Cecil Street. These precincts are predominantly office-zoned, served by MRT interchanges like Raffles Place, Downtown, and Tanjong Pagar stations. The core CBD market offers limited availability of quality office space, which compresses vacancy and supports rents.
City fringe strata office covers clusters at the edge of the core: Bugis, Beach Road, Rochor, Kallang, Alexandra/Redhill, Novena, and Paya Lebar. Zoning is often mixed use, with office, retail, hotel, and sometimes residential components in the same development or precinct. City fringe locations have experienced robust spillover demand from the core CBD, driven by tenants seeking lower rents within acceptable proximity.
Suburban business hubs are established decentralised office nodes: Tampines Regional Centre, Jurong Gateway, One-North/Buona Vista, Changi Business Park, and Woodlands Regional Centre. Tenants here include MNC back-offices, tech firms, government agencies, engineering companies, and local SMEs. Suburban business hubs offer a variety of tenants including local SMEs and logistics companies. These definitions underpin the rental and yield comparisons in the sections that follow.
2026 Snapshot: Strata Office Rental Yields by Location
Location is the first variable that determines achievable strata office yield in Singapore. The data below is indicative and varies by building age, floor plate, and tenant profile. Singapore’s strata office market has a total sales value projected at approximately $1 billion for 2026, reflecting sustained investor appetite across all three zones.

CBD Strata Office Yields in 2026
Core CBD Grade A rents reached S$12.40 psf per month as of Q3 2026, according to CBRE’s Singapore market figures. Core CBD rents increased 5.3% in the first nine months of 2026. Strata office sale prices in the CBD range from approximately S$2,500 to S$4,000 psf, with prime freehold towers at the upper end. Indicative rents for smaller, well-located strata units sit between S$9 and S$13 psf per month, depending on building specification, floor level, and whether the unit occupies upper floors with better views.
Gross rental yields in Singapore’s core CBD range from 3.5% to 4.5%. Net rental yield for core CBD locations averages around 3.5% to 3.8%, after MCST service charges (typically S$1.00–1.50 psf per month in Grade A buildings), property tax at 10% of annual value, and vacancy provisions.
CBD vacancy is low. Grade A CBD office space shows approximately 2.6% vacancy as of Q3 2026, down from 3.3% in Q2. Overall office vacancy in Singapore stands at 5.1%. Strata blocks may exhibit slightly higher frictional vacancy than institutional Grade A towers due to fragmented leasing; a typical 1,000 to 2,000 sq ft CBD unit in 2026 takes two to four months to lease depending on spec and asking rent. Grade A CBD office rents reached S$11 to S$13 per square foot by 2025, and continued climbing into 2026.
CBD properties are generally preferred for capital preservation and extensive corporate tenant demand. Prime CBD office assets yield lower than decentralised strata units, but the trade-off is tenant depth (finance, legal, corporate headquarters), better liquidity on resale, and perceived prestige; some occupiers will pay CBD rents because the address supports credibility, visibility, and deal-making, while others may decide they cannot afford that premium. For investors who prioritise capital appreciation over running income, CBD strata remains the default.
City Fringe Strata Office Yields in 2026
City fringe sale prices in 2026 range from approximately S$1,900 to S$3,000 psf, depending on building age, freehold versus leasehold tenure, and proximity to MRT stations. Indicative rents run between S$6.50 and S$9.50 psf per month. Knight Frank’s Q4 2025 data placed city fringe asking rents at S$7.10 to S$7.95 psf per month across Alexandra/Harbourfront, Novena, Newton, and Paya Lebar; 2026 figures have nudged upward in better-connected nodes. City fringe properties provide a balance of rental yield and accessibility for businesses.
Gross rental yields for city fringe properties range from 4.0% to 5.5% on stabilised leases. Net rental yield for city fringe locations averages around 3.8% to 4.3%, after typical MCST fees (S$0.70–1.10 psf per month for Grade B buildings) and conservative vacancy assumptions. Asking rents in the CBD fringe experienced a minor adjustment of -0.9% in Q3 2026, a reminder that fringe rents do not move in lockstep with core CBD.
Tenant demand is diversified: tech firms, creative agencies, medical and healthcare practices, education and training providers, childcare centres in mixed use developments, and domestic corporates. Lower headline rents attract cost-sensitive occupiers leaving CBD. Strata offices are typically easier to lease to established tenants in fringe locations because the entry prices are more accessible, and the tenant pool spans multiple sectors rather than concentrating in finance and law.
City fringe strata can deliver a hybrid of yield and liquidity, with 2026 tenant demand supported by spillover from the core and by the growth of sectors like e commerce support services and digital agencies that value address proximity without paying CBD rates.
Suburban Business Hubs Strata Office Yields in 2026
Indicative sale prices in hubs like Tampines, Jurong Gateway, One-North, and Woodlands range from S$1,300 to S$2,200 psf, with newer integrated developments at the upper end. Rents sit between S$4.50 and S$7.00 psf per month. Cushman & Wakefield’s suburban data shows Suburban East rents around S$4.90–5.40 psf per month and Suburban West at S$5.80–6.30 psf per month, with vacancy in Suburban West at 5.1–5.7%.
Suburban business hubs can achieve gross rental yields up to 6.0% for well-leased assets. Net rental yield for suburban business hubs averages around 4.2% to 4.8% after conservative vacancy and cost provisions. The gap between gross and net is wider here because vacancy buffers need to be larger; investors in the suburban sector face higher vacancy risks compared to the CBD sector.
Tenant profiles lean toward back-office functions of MNCs and banks, government agencies, engineering firms, and life sciences companies (especially at One-North). SMEs that prioritise staff commute, parking, and budget-friendly occupancy costs fill remaining demand. Some hubs are more cyclical; Changi Business Park’s concentration in financial back-office makes it sensitive to banking sector headcount decisions. One-North’s life sciences and tech skew ties it to venture capital cycles and government grants.
Suburban strata delivers the highest income yields in 2026 but with thinner resale markets, longer vacancy durations when tenants vacate, and more variable performance between individual buildings.
Comparing CBD, City Fringe, and Suburban Hubs: Yields, Vacancy Risk, and Tenant Demand
Raw yield numbers become meaningful only when framed against vacancy risk, tenant depth, and the cost of re-leasing. A 5.5% gross yield with six months of vacancy every lease cycle can underperform a 3.8% gross yield with one month of downtime over the same period. This section synthesises the preceding snapshots into a decision-friendly comparison.
Side-by-Side Comparison: 2026 Strata Office Metrics
Yield ranges. Gross yields run lowest in the CBD (3.5–4.5%), sit in the middle at the city fringe (4.0–5.5%), and peak in suburban hubs (4.2–6.0%). Net yields after 5–10% vacancy provision and MCST/service charges compress each band: CBD net at 3.5–3.8%, fringe net at 3.8–4.3%, suburban net at 4.2–4.8%. Decentralised strata office rents remained stable post-pandemic, which helped sustain suburban yield levels.
Vacancy and downtime. CBD strata units average one to two months of vacancy between leases in a normal market. City fringe units sit at two to four months, depending on building specification and location relative to the nearest MRT station. Suburban hubs average three to six months or longer, particularly in mono-industry estates or older buildings without modern amenities. Lease tenure also varies: CBD leases tend to run two to three years with renewal options; suburban leases sometimes run shorter for SME tenants with less predictable growth.
Tenant depth and concentration risk. The CBD draws from a broad white-collar base: finance, legal, insurance, corporate headquarters. The city fringe attracts professional services, tech, healthcare, and creative segments. Suburban hubs see back-office functions, engineering, government, and local SMEs. One-North skews heavily toward biomedical and tech; Changi Business Park concentrates financial operations. Concentration raises the risk that a sector downturn leaves multiple units vacant simultaneously.
Capital value and resale liquidity. CBD strata units are the most liquid; a broader buyer pool (institutions, overseas investors, family offices) competes for limited freehold stock. Fringe units trade at moderate liquidity, constrained by building age and strata condition. Suburban units move slowly; resale periods can stretch to six to twelve months in weaker buildings, and per-square-foot price variance is wide depending on whether the unit is business park specification or standard office.
The trade-off in summary: CBD delivers stronger resilience and liquidity at a lower yield. Suburban hubs offer a yield premium but require more selective underwriting. The city fringe sits as a hybrid, and for many investors, it is the practical starting point.
How Yield, Vacancy, and Tenant Risk Profile Interact
Higher quoted yields in suburban and fringe strata offices compensate for three specific risks: longer expected vacancy periods between leases, higher probability of tenant churn or sector-specific disruption, and less liquid exit markets when selling the unit.
Consider two scenarios. A CBD unit purchased at S$3,200 psf generates S$11 psf per month in rent: 4.1% gross yield, but that headline number does not help if the tenant cannot pay the rent consistently through the lease term. Expected downtime is one month every three years, which reduces annualised gross yield to roughly 3.8% before costs. Net yield after MCST, property tax, and leasing fees: approximately 3.0%. Over a 10-year hold, the investor collects nine years and eight months of rent from ten lease-years.
A suburban unit at S$1,600 psf generates S$6.50 psf per month: 4.9% gross yield. But if the anchor tenant vacates and backfill takes six months, annualised gross yield drops to about 4.1% in that lease cycle. If this recurs twice over a decade (plausible in a hub with narrow tenant demand), the 10-year effective gross yield falls below the CBD unit’s. Tenant type and lease length also matter: a childcare operator on a long lease can deliver lower but more resilient income than a newer F&B tenant on a short two-year lease. The suburban unit’s higher starting yield covers a different risk profile, not a free premium.
These dynamics are why modelling location-specific vacancy assumptions, rather than using a single island-wide vacancy rate, separates credible underwriting from marketing arithmetic. When conditions favour landlords, investors assessing leased units should review flexibility, fit-out obligations, cash-flow protections, and assignment or subletting rights rather than focusing only on headline rent.
Building a Practical Yield Model for Strata Offices in 2026
Investors who move beyond headline yields and build a simple, repeatable model for each shortlisted unit make better purchase decisions. This is also where advisory support from Aesthetic Havens adds value, especially for first-time commercial property buyers who may be more familiar with residential investment metrics.
A Simple 4-Step Yield and Risk Modelling Process
Step 1: Collect inputs. Gather the purchase price per square foot, total floor area, achievable rent per square foot based on 2025–2026 comparables for the same building or a comparable nearby, MCST fees (check the building’s latest budget, not a generic estimate), property tax rate (10% of annual value for commercial), insurance, and financing costs if leveraged.
Step 2: Estimate realistic vacancy and incentives. A new lease in the city fringe typically includes one to two months of rent free periods. Agency fees run at one month’s rent. Confirm what the tenant is expected to pay versus what the owner must absorb, especially for fit-out and reinstatement items. If the average lease length is three years, spreading two months of vacancy and incentives across 36 months adds 5.6% to effective vacancy. In suburban hubs, budget for three to four months of downtime per lease cycle. Include fit out amortisation if the landlord contributes to tenant fit-out.
Step 3: Calculate gross and net yields for three scenarios. Optimistic (full occupancy, no incentives, rent at the upper end of comparables), base case (one to two months vacancy, market-rate rent, standard incentives), and conservative (three to four months vacancy, rent at the lower end, one rent-free month). For a S$2,500,000 city fringe unit (1,200 sq ft at S$2,083 psf) with base-case rent of S$8.50 psf per month: gross annual rent is S$122,400, gross yield 4.9%. Deduct S$12,960 in MCST (S$0.90 psf/month), S$12,240 in property tax, S$8,000 for vacancy/incentives annualised, and S$3,000 for insurance and leasing. Net income: S$86,200. Net yield: 3.4%.
Step 4: Compare outcomes across locations and buildings. Rank not just by yield but by break-even rent (the minimum rent needed to cover all costs and debt service), sensitivity to a 10–15% rent decline, and the spread between conservative-case yield and your required return. Also check whether the target tenant pool in that micro-location can realistically pay that rent, not just whether the numbers look attractive on paper.
Location-Specific Assumptions for 2026
Default assumptions should differ by zone. For CBD units, model stronger rent growth (core CBD rents rose 5.3% in the first nine months of 2026) but accept a lower starting yield. Vacancy provisions can be conservative at 3–5% of annual rent. Tenant quality is higher, and lease renewals are more predictable.
For city fringe, use moderate rent growth assumptions. Rents in some fringe pockets adjusted downward by 0.9% in Q3 2026, so do not assume uniform increases. Vacancy provisions of 5–8% are prudent. The tenant pool spans SMEs, healthcare, and creative firms, which brings diversification but also introduces tenants with shorter operating histories.
Suburban hub models should incorporate flatter rent growth or even flat rents in clusters with upcoming supply (Jurong Gateway has new office towers in the pipeline). Vacancy buffers of 8–12% of annual rent protect against the reality that suburban units take longer to backfill. Industrial space has recorded 20 consecutive quarters of rental growth, and some suburban nodes blur the line between office and industrial/business park stock; ensure you are comparing like with like.
Adjust for building age and specification (a 2015-built Grade A suburban development performs differently from a 1990s Grade B block), connectivity (units within 400 metres of an MRT station lease faster), and tenant sector exposure. Using consistent, location-aware assumptions allows apples-to-apples comparison across CBD, fringe, and suburban units.
Applying a Hurdle Rate to Decide if Yield Justifies Risk
A hurdle rate is the minimum net yield required after costs and vacancy to justify the risk and illiquidity of a strata office investment. For lower-risk CBD strata with strong tenant demand and resale liquidity, a hurdle rate of 3.0–3.5% net may be acceptable. For suburban hubs with thinner exit markets, investors typically require 4.0–4.5% net or higher.
Set your hurdle rate based on three factors: leverage (higher debt service requires higher net yield to maintain positive cash flow), investor profile (income-focused investors need higher current yield; those prioritising capital appreciation may accept lower running yield in the CBD), and location-specific risk.
Compare each property’s conservative-case net yield to its relevant hurdle rate. If a suburban unit’s conservative net yield is 3.8% but your hurdle for suburban is 4.5%, the deal does not work at the asking price. Either negotiate the purchase price down, or move to a different unit. Headline “gross yield” figures quoted in marketing materials almost never survive contact with realistic cost and vacancy assumptions.
Common Challenges When Investing in Strata Offices by Location
In 2026, the most common mistakes stem not from misreading headline yields but from misjudging leasing risk, MCST cost trajectories, or tenant demand shifts. These challenges manifest differently across CBD, fringe, and suburban settings.
Overestimating CBD Rental Growth and Underestimating Costs
Some buyers assume CBD rents will always rise fast enough to offset high entry prices and financing costs. Grade A CBD office rents reached S$11–S$13 per square foot by 2025 and climbed to S$12.40 psf by Q3 2026, but these figures reflect institutional whole-floor leases, not necessarily the rents achievable in smaller strata units on lower floors.
Benchmark against recent CBD strata lease renewals, not headline Grade A statistics. Older strata blocks in the CBD carry MCST sinking fund obligations for lift replacement, façade upgrades, and waterproofing that can trigger special levies of S$50,000 to S$100,000 per unit. Include these in your hold-period cost estimate. Stress-test a scenario where rent growth stalls for two to three years; if net yield drops below your hurdle rate, the unit is mispriced for your requirements.
Underpricing Vacancy Risk in Fringe and Suburban Hubs
Investors drawn to 5%+ gross yields in hubs like Changi Business Park or older Tampines buildings sometimes ignore the practical implication of longer backfill times. A six-month vacancy on a suburban unit wipes out more than half the year’s rental income in a single event.
Use longer vacancy assumptions for mono-industry estates or buildings dependent on one or two anchor tenants. Check upcoming supply pipelines; new office and mixed use towers in Jurong Gateway will pressure older stock in the same precinct. Prefer buildings with diversified tenants and modern specifications. Singapore’s retail occupancy has remained between 93% and 94% since 2025, but office occupancy in suburban markets does not enjoy the same floor; suburban malls may stay full while the office tower above them struggles with vacancy.
Misaligning Tenant Profile With Location and Unit Size
Buying units whose size, layout, or location do not match the 2026 tenant pool creates structural vacancy. A 3,000 sq ft strata plate in a suburban hub where most demand is for 600 to 1,500 sq ft units will sit empty longer and command lower rents per square foot than a right-sized alternative.
Study current and recent tenants in the building and surrounding projects. At One-North, tech and life sciences admin functions cluster in 800 to 1,200 sq ft units. In Novena and Paya Lebar, medical and education tenants want ground or second-floor access and specific fit-out configurations. Retail properties in suburban areas serve 3.2 million residents, meaning that mixed use buildings with ground-floor retail and upper-floor office can benefit from foot traffic, but only if the office unit layout matches local demand. Consider whether the MCST rules and building design allow subdivision or combination of units to adapt to shifting tenant requirements.
Conclusion and Next Steps
In 2026, Singapore strata office rental yields form a location-driven spectrum. CBD strata delivers 3.5–4.5% gross (3.5–3.8% net) with the strongest liquidity, capital preservation, and tenant depth. City fringe yields run 4.0–5.5% gross (3.8–4.3% net) with balanced risk. Suburban hubs reach up to 6.0% gross (4.2–4.8% net) but carry higher vacancy exposure and thinner resale markets. Net yields across all property sectors generally run 1% to 2% lower than gross yields after expenses. The right choice depends on your investment horizon, income requirements, and tolerance for leasing risk.
Actionable next steps:
-
Shortlist two to three preferred location types based on your desired balance between yield, capital growth, and resilience.
-
Gather recent rent and sale comparables for specific buildings in those zones. Office Navi Singapore publishes asking rents by precinct; URA data covers transaction prices.
-
Build a gross-to-net yield model for each candidate unit using conservative vacancy and cost assumptions calibrated to the location.
-
Set a location-specific hurdle rate (3.0–3.5% net for CBD, 3.5–4.0% for fringe, 4.0–4.5% for suburban) and drop assets that do not clear it under conservative assumptions.
-
Contact Aesthetic Havens for a deeper review of vacancy risk, tenant demand, and fit with your business operations if you plan owner-occupation.
Related topics worth exploring: how industrial strata yields compare to office yields in Singapore’s current market (industrial space has recorded 20 consecutive quarters of rental growth), and financing structures for commercial property given the higher equity requirements.
Additional Resources
Below are references and tools for Singapore strata office investors conducting due diligence in 2026:
-
URA office rental and price indices for CBD, fringe, and decentralised sub-markets, updated quarterly. Essential for tracking whether rents in your target precinct are rising or softening.
-
IRAS guides on commercial property tax, including the 10% rate on annual value for non-residential properties and stamp duty schedules applicable to strata office purchases.
-
Aesthetic Havens’ Singapore commercial and industrial yield guides, covering office vs warehouse vs business park yield comparisons and tenant demand by location.
-
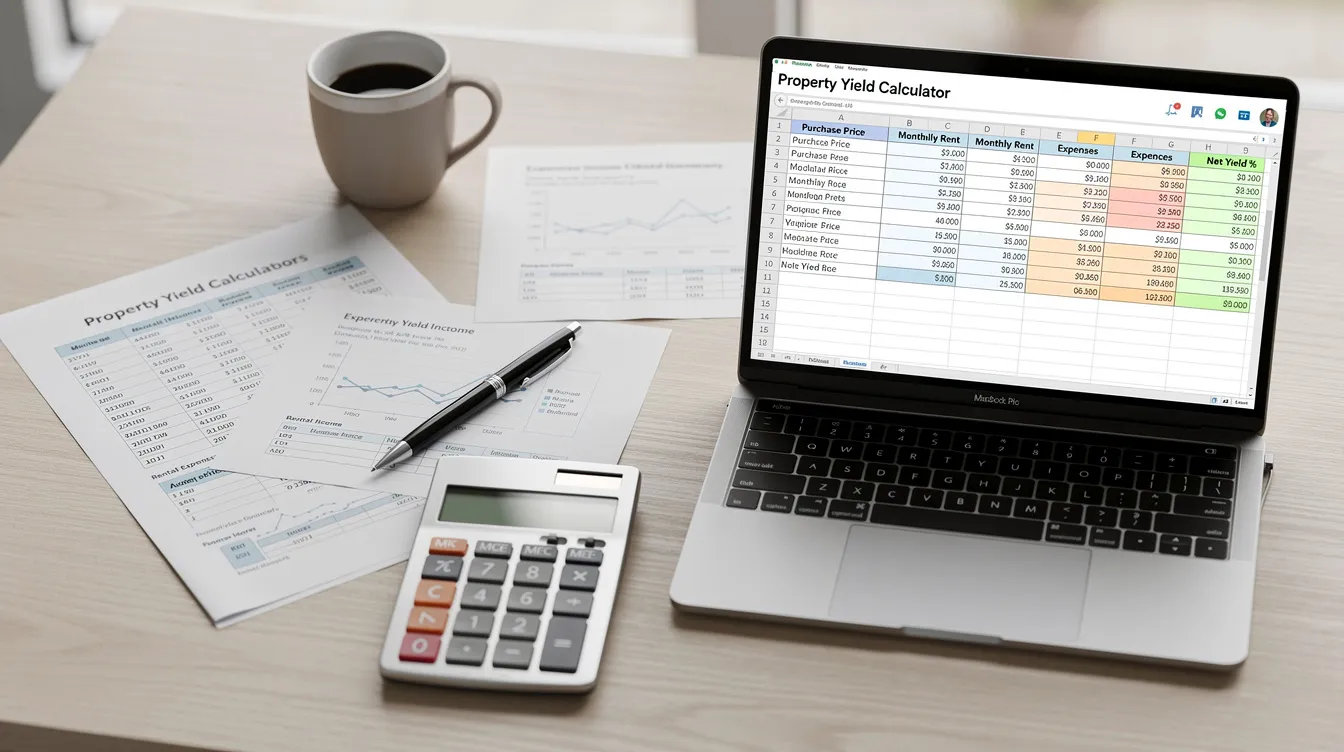
A downloadable yield calculator template from Aesthetic Havens for modelling gross and net rental yields across CBD, fringe, and suburban locations with adjustable vacancy, MCST, and incentive inputs.
Contact Aesthetic Havens for customised yield benchmarking by building and for assistance sourcing strata office opportunities aligned with your 2026 investment objectives.

