

Introduction
In this new launch vs resale case study, we track two real-world-modelled buyers who purchased 3-bedroom units in the same outside central region condo – one at early bird pricing in 2020, the other as a resale unit after TOP in 2024. The result: the early bird buyer at the OCR launch outperformed the later resale buyer on capital appreciation, cash-on-cash return, and cash flow flexibility by a wide margin.
This article focuses on entry price, payment schedule, and value at TOP for each buyer, with brief mentions of rental income and tax considerations where relevant. It is written for Singapore-based upgraders, HDB upgraders, business owners, and investors deciding between an OCR new launch and OCR resale properties – especially those juggling business cash flow alongside property decisions.
The direct answer: In this case, buying early at the launch price delivered roughly 26–32% total returns by 2026, compared with 7–11% for the later resale buyer, while requiring less concentrated cash outlay thanks to the progressive payment scheme. The early bird buyer accepted construction and market risk but was compensated with a lower entry price and a more flexible payment cadence.
Here is what you will gain from this case study:
-
Concrete numbers comparing new launch entry vs resale entry for the same OCR condo project
-
How the progressive payment schedule affects business owners’ cash flow versus a lump-sum resale purchase
-
Capital value at TOP and two years after TOP for both buyers
-
A cash-on-cash return comparison showing why timing matters in the property market
-
A simple framework for deciding if buying early in an OCR project makes sense for your situation
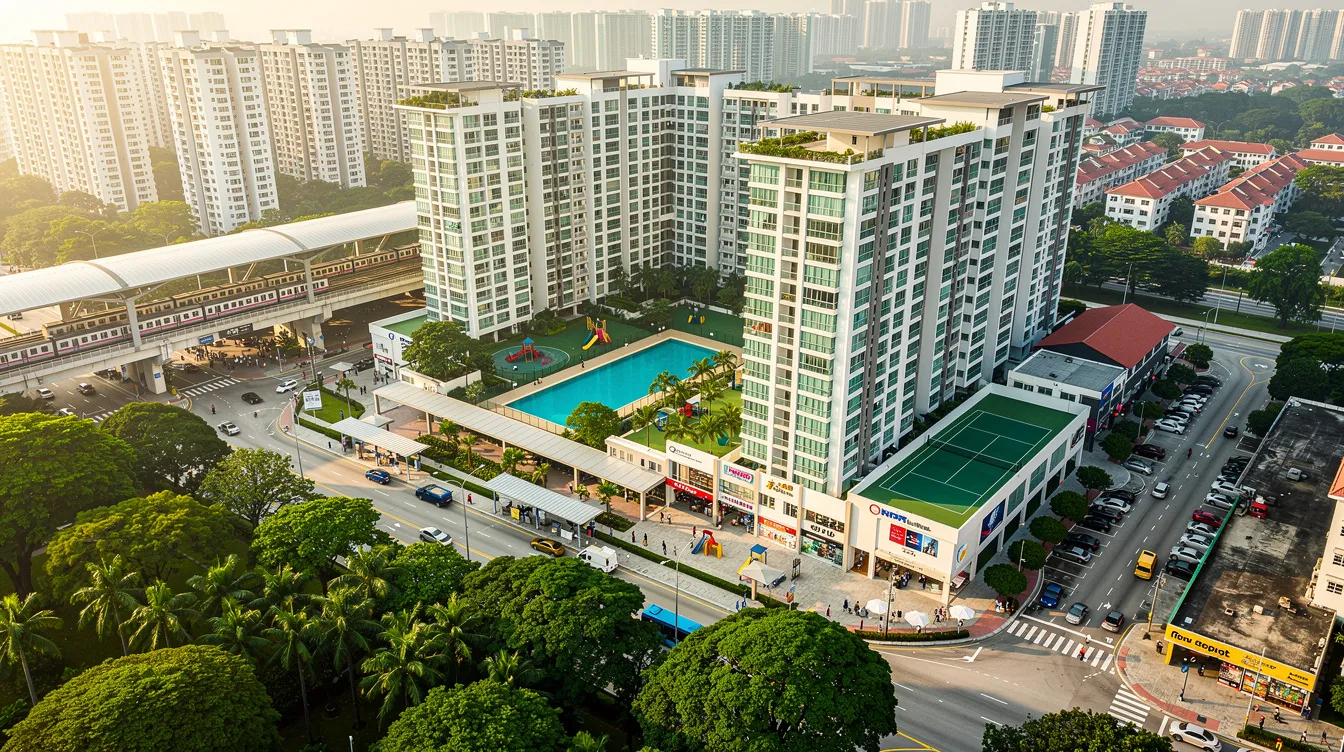
Understanding New Launch vs Resale in Singapore’s OCR
The outside central region encompasses Singapore’s suburban estates – areas away from the core central region CCR and the rest of central region fringe. OCR residential developments are a primary target for HDB upgraders, young families seeking larger units, and SME owners who want lower cost per square foot with access to modern amenities and transport links. The OCR market attracts primarily budget-conscious buyers, which is precisely why capital appreciation in this segment has outpaced the CCR market over the past decade.
Before we dive into the specific numbers, this section establishes the foundational concepts behind each purchase type so the comparison is genuinely apples-to-apples.
What Counts as an OCR New Launch Purchase?
A “new launch” is a private housing unit sold by a developer under a Sale & Purchase Agreement, typically before or during construction. These are building-under-construction (BUC) purchases where buyers commit based on showflat layouts, floor plans, and developer track records – without seeing the completed product.
Typical OCR launches share several characteristics: 99-year leasehold tenure, mass-market positioning, family-sized efficient layouts, and locations near upcoming or operational MRT lines such as the Cross Island Line or Jurong Region Line corridors. These projects range from 800 to 1,200+ units sold across multiple phases, with developers often using early bird pricing to manage market demand and build initial take-up momentum.
Under the BUC framework, early buyers pay via the Progressive Payment Scheme (PPS), committing capital in stages tied to construction milestones rather than all at once. The Progressive Payment Scheme allows early buyers to pay incrementally tied to construction milestones – a structure that has real implications for business owners’ working capital.
In this case study, Buyer A purchased at the main launch weekend of a 900+ unit OCR project in September 2020.
What Counts as a Resale Purchase at or After TOP?
A “resale” purchase means buying a unit from an existing owner, usually when the project is close to or has already received its Temporary Occupation Permit (TOP). Resale buyers pay based on a finished, visible product – they can inspect workmanship, assess noise levels, check the actual view from the stack, and evaluate surrounding amenities.
The trade-off: the asking price for a resale unit reflects completed-building certainty, any furnishing or renovation premium the seller has invested, and – critically – whatever price increases the broader market has delivered since original launch. Many buyers assume resale is inherently “safer” because they see what they get, but this certainty comes at a cost premium.
In this case study, Buyer B bought a similar 3-bedroom resale unit in the same project in mid-2024, after TOP, at a higher price per square foot reflecting the post-TOP market reality.
Understanding these two purchase types sets up the detailed financial comparison that follows. The question is not which type is inherently better – it is which delivered superior outcomes under specific, verifiable conditions.
Introducing the OCR Case Study: Two Buyers, Same Condo, Different Timing
We now move from definitions to a concrete scenario. Both buyers purchased in the same 99-year OCR condo, launched in the second half of 2020 and achieving TOP in the first half of 2024. The project sits near an MRT station on an upcoming line in a mature suburban town – a location profile typical of OCR projects that attract strong upgrader demand.
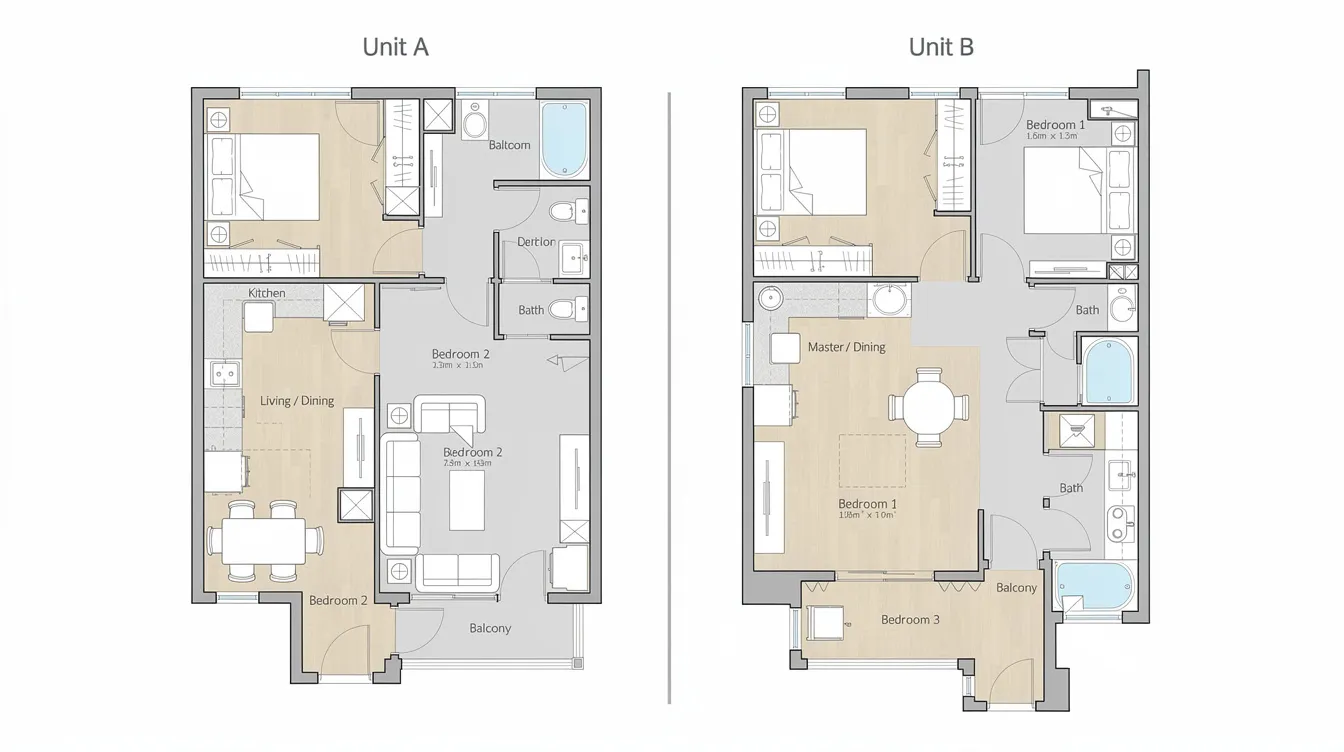
Both buyers chose 3-bedroom units of similar size (980–1,020 sq ft), within comparable stacks and orientations. Unit selection impacts future resale value and marketability, so keeping stack and facing similar isolates the timing variable we want to examine.
Buyer A: Early-Bird OCR Launch Purchaser (2020)
Buyer A is a 38-year-old SME owner running a logistics business, upgrading from an HDB flat in Punggol. He attended the launch weekend in September 2020, when COVID-19 uncertainty had dampened buyer psychology across the property market – creating an environment where developers priced competitively to secure sales volume.
Key purchase details:
-
Unit size: ~990 sq ft, 3-bedroom
-
Entry price: S$1.25M (approximately S$1,262 per square foot)
-
Option fee: 5% (S$62,500) on booking
-
Downpayment structure: 25% total (S$312,500 in cash and CPF), paid progressively
-
Bank loan: 75% LTV (S$937,500), 25-year tenure
-
Interest rate environment: Promotional fixed packages at approximately 1.5–2.0% in 2020’s low-rate climate
As an early buyer, Buyer A benefited from the developer’s launch-weekend pricing – the earliest and lowest tier on the pricing curve. Over 90% of new launch owners sell at a gain historically, but the magnitude of that gain depends heavily on the entry price achieved.
Buyer B: Resale Purchaser at or Just After TOP (2024)
Buyer B is a 42-year-old professional services business owner, upgrading from another OCR condo. She prioritised immediate move-in, a visible finished product, and the option to generate rental income quickly if plans changed.
Key purchase details:
-
Unit size: ~1,000 sq ft, 3-bedroom with similar facing and stack tier
-
Entry price: S$1.48M (approximately S$1,480 per square foot)
-
Payment structure: Full 25% downpayment (S$370,000 in cash and CPF) due at completion, plus buyer’s stamp duty
-
Bank loan: 75% LTV (S$1.11M), disbursed in full at completion
-
Interest rate environment: Fixed and floating packages at approximately 3.5–4.0% given 2024’s higher SORA-based rates
-
TDSR constraint: Monthly servicing stress-tested at higher qualifying rates under MAS’s 55% TDSR threshold
Buyer B was consciously paying a premium for certainty. The lumpier payment profile meant a larger, concentrated cash and CPF drawdown – with immediate full loan servicing at rates roughly double what Buyer A secured four years earlier.
Side-by-Side Snapshot of Both Buyers at Point of Purchase
|
Metric |
Buyer A (2020 Launch) |
Buyer B (2024 Resale) |
|---|---|---|
|
Purchase year |
September 2020 |
Mid-2024 |
|
Unit size |
~990 sq ft |
~1,000 sq ft |
|
Price per sq ft |
S$1,262 |
S$1,480 |
|
Total purchase price |
S$1.25M |
S$1.48M |
|
Loan quantum (75% LTV) |
S$937,500 |
S$1.11M |
|
Interest rate band |
1.5–2.0% |
3.5–4.0% |
|
Immediate cash + CPF outlay |
S$62,500 (5% booking) |
S$370,000 (25% at completion) |
|
Payment structure |
Progressive (staged over ~3.5 years) |
Lump-sum at completion |
|
Possession at purchase |
None (BUC) |
Immediate or near-immediate |
Buyer B paid S$230,000 more than Buyer A for a virtually identical unit – an 18.4% premium driven by four years of price increases and the completed-product premium. The next section dissects how this price gap and each buyer’s payment structure shaped their financial outcomes.
Entry Price and Payment Schedule: How Timing Changed the Math
The headline price difference is only part of the story. The timing and structure of payments – and the interest rate environment in which each buyer borrowed – created dramatically different cash flow profiles. For business owners, this is where the real divergence begins.
Entry Price Gap: Early Bird Pricing Launch vs Post-TOP Resale
Developer pricing in OCR new launches follows a predictable curve. Early phases are priced to attract volume – developers often use early bird pricing to manage market demand and build momentum for the next phase of sales. As units sold increase and construction progresses, each subsequent pricing tier rises.
In this project:
-
Buyer A’s early bird entry: S$1.25M (S$1,262 psf)
-
Developer’s own unsold units near TOP: S$1.38M–S$1.42M (S$1,394–S$1,434 psf)
-
Buyer B’s resale purchase from an owner: S$1.48M (S$1,480 psf)
New launches typically see price increases after early sales – in this case, the developer’s own pricing rose approximately 10–14% from launch to near-TOP. Later entrants may also be buying much closer to peak prices, especially when the completed-unit premium is already built in. Buyer B’s resale price added a further premium as the original owner sought to lock in margin on a completed unit.
|
Buyer A |
Buyer B |
Difference |
|
|---|---|---|---|
|
Price per sq ft |
S$1,262 |
S$1,480 |
+S$218 psf (+17.3%) |
|
Total price |
S$1.25M |
S$1.48M |
+S$230,000 (+18.4%) |
That S$230,000 gap – roughly the cost of a respectable renovation and furnishing budget – represents capital Buyer B committed before seeing any appreciation from her own holding period.
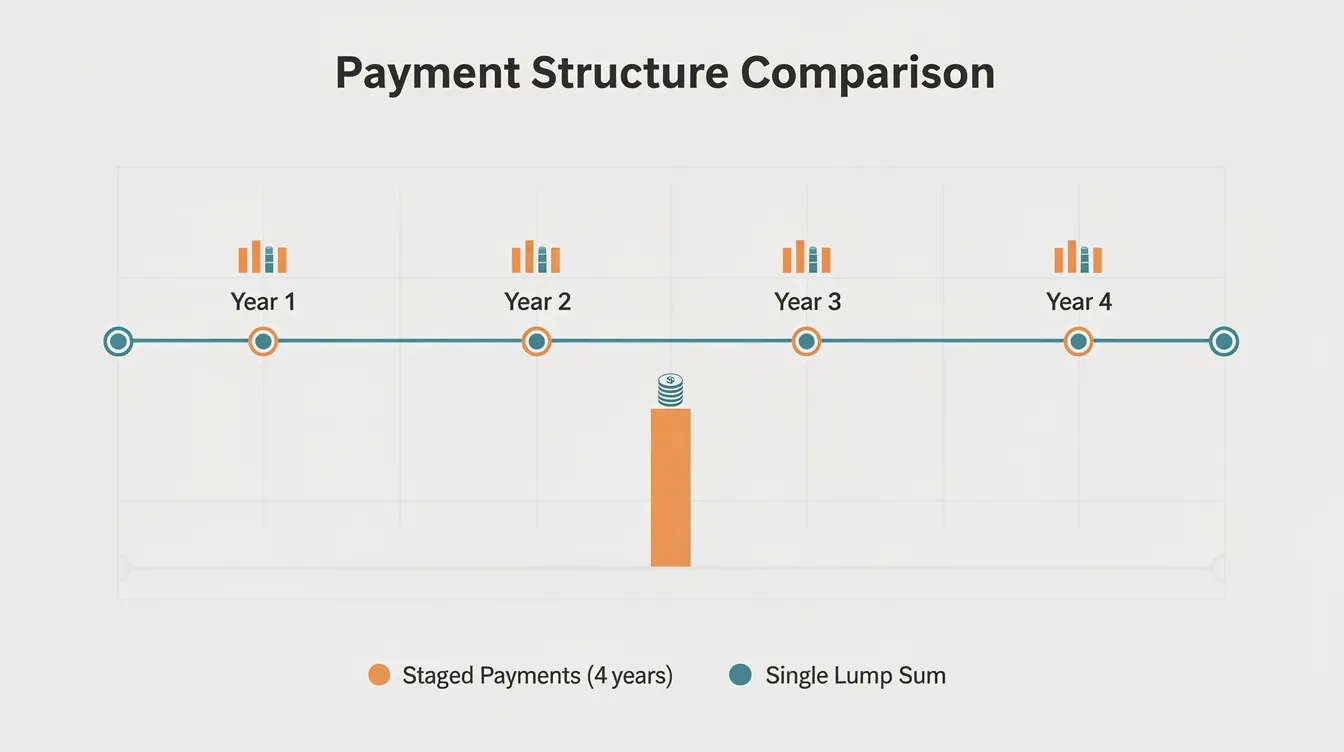
Progressive Payment Schedule vs Lump-Sum Completion: Cash Flow Contrast
This is where the first mover advantage becomes most tangible for business owners.
Buyer A’s progressive payment timeline:
-
September 2020: 5% booking fee – S$62,500
-
November 2020: Additional 15% on S&P execution – S$187,500 (cumulative: 20%)
-
Mid-2021: 10% at foundation – S$125,000 (cumulative: 30%)
-
Late 2021: 10% at structural framework – S$125,000 (cumulative: 40%)
-
2022–2023: Four tranches of 5% each at partition walls, roofing, wiring/fittings, infrastructure – S$62,500 each (cumulative: 60%)
-
Early 2024: 25% at TOP/CSC – S$312,500 (cumulative: 85%)
-
Mid-2024: 15% at legal completion – S$187,500 (cumulative: 100%)
This staggered structure meant Buyer A’s cash and CPF drawdowns were spread across approximately 3.5 years. For an SME owner in logistics, this alignment with business revenue cycles preserved working capital for inventory, hiring, or expansion – the payments arrived in digestible portions rather than a single concentrated demand.
Buyer B’s payment timeline:
-
Mid-2024: Full 25% downpayment (S$370,000) plus stamp duties at completion
-
Mid-2024 onward: Full monthly loan servicing on S$1.11M at 3.5–4.0%
Buyer B’s cash and CPF commitment was front-loaded into a single quarter, with immediate monthly instalments roughly 70–90% higher than Buyer A’s equivalent servicing (due to both the larger loan quantum and higher interest rate).
Carrying Costs Up to and Immediately After TOP
Carrying costs during the construction period reveal another layer of advantage for the early bird buyer.
Buyer A’s carrying costs (2020–2024):
-
Interest was charged only on disbursed loan portions. In 2020–2021, only 20–30% of the loan was drawn down, at rates around 1.5–2.0%. The monthly interest bill during early construction was a fraction of full servicing.
-
Maintenance fees: zero until TOP.
-
Property tax: not applicable until completion.
Buyer B’s carrying costs (from mid-2024):
-
Full loan interest on S$1.11M from day one, at 3.5–4.0% – approximately S$3,200–S$3,700 per month in interest alone during early amortisation.
-
Maintenance fees began immediately.
-
Property tax applied from first full assessment year.
The early-bird buyer enjoyed a lower entry price, more flexible payment cadence, and substantially lower carrying costs during the building period. The resale buyer traded these advantages for instant possession and the ability to generate rental income or move in immediately.
Value at TOP and Beyond: Who Actually Did Better?
This section quantifies actual gains at TOP in 2024 and projects positions to end-2026, providing the definitive comparison between these two timing strategies.
Estimated Market Value at TOP (2024)
OCR non-landed prices surged 46% from 2020 to 2025 – one of the strongest growth periods in Singapore’s private market history. For this project, comparable 3-bedroom units at or shortly after TOP were transacting at approximately S$1.50M–S$1.55M in mid-2024, consistent with the broader OCR new-sale median of around S$2,075 psf in 2024 for similar gradings.
|
Buyer A |
Buyer B |
|
|---|---|---|
|
Entry price |
S$1.25M |
S$1.48M |
|
Estimated market value at TOP |
S$1.52M |
S$1.52M |
|
Unrealised gain |
~S$270,000 (21.6%) |
~S$40,000 (2.7%) |
For Buyer A, the paper gain at TOP represented the payoff for accepting construction risk and a four-year wait. For Buyer B, the narrow buffer above purchase price left little room to absorb stamp duties, transaction costs, or any market softening. Early bird pricing can lead to stronger capital appreciation – this case illustrates exactly why.
Two Years After TOP: Capital Appreciation, Gains and Equity Positions
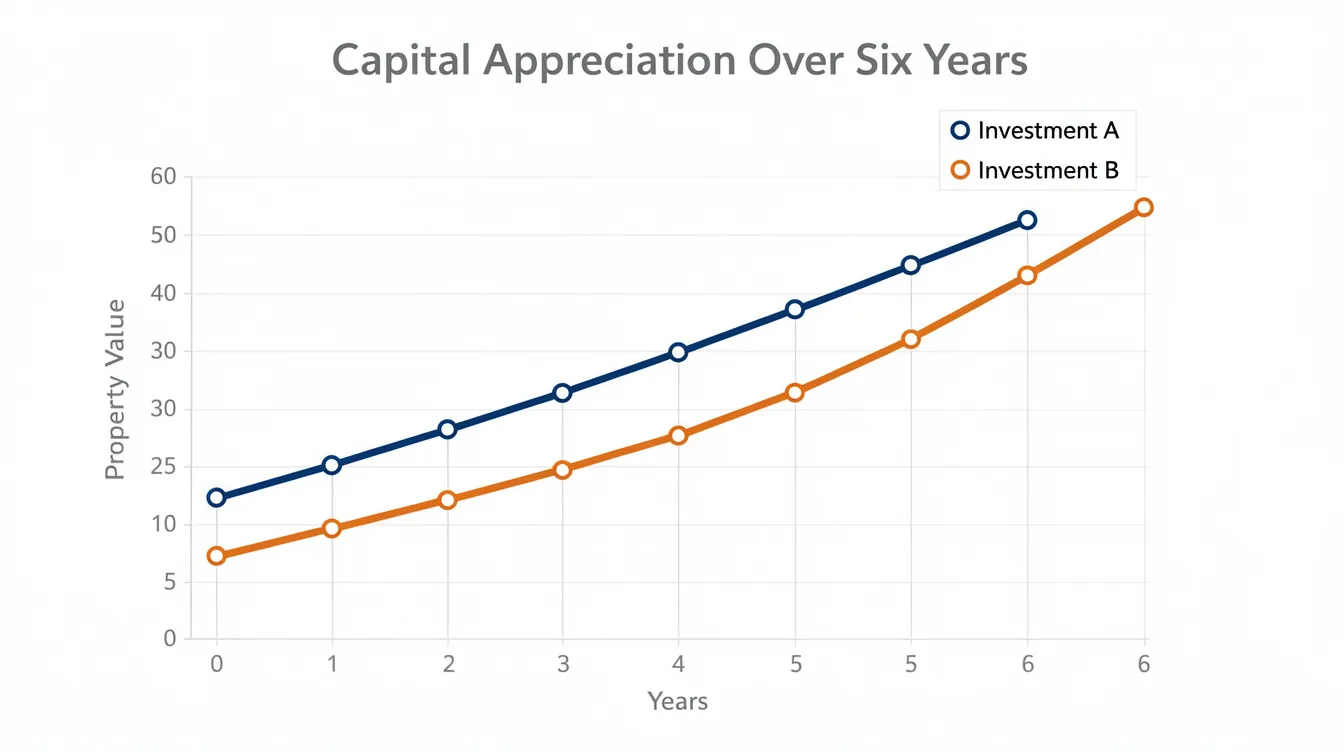
In Q1 2026, OCR property prices rose by 2.2% quarter-on-quarter, leading national price growth. Projecting moderate growth of 5–8% from mid-2024 to end-2026 yields an estimated market value of S$1.58M–S$1.65M for similar stack and size units.
Buyer A’s position at end-2026:
-
Estimated market value: ~S$1.62M
-
Total paper gain from 2020 entry: ~S$370,000 (29.6%)
-
Outstanding loan reduced by approximately S$50,000–S$60,000 through principal repayments over ~2.5 years of full servicing
-
Total equity position (market value minus outstanding loan): approximately S$720,000–S$740,000
Buyer B’s position at end-2026:
-
Estimated market value: ~S$1.62M
-
Total paper gain from 2024 entry: ~S$140,000 (9.5%)
-
Outstanding loan reduced by approximately S$35,000–S$40,000 through principal repayments over ~2 years
-
Total equity position: approximately S$545,000–S$560,000
The holding period for maximum Seller’s Stamp Duty is now four years, meaning Buyer A could sell freely by late 2024 without SSD, while Buyer B would face SSD if selling before mid-2028 – a constraint that affects exit flexibility.
Cash-on-Cash Return: Comparing What Each Buyer Tied Up
Cash-on-cash return measures net gain divided by total cash and CPF invested – the most practical metric for a business owner evaluating opportunity cost.
Buyer A:
-
Total cash and CPF committed (2020–2024): approximately S$312,500 in downpayment plus stamp duties of ~S$28,000 = ~S$340,500
-
Estimated net gain at hypothetical 2026 sale (after agent fees ~2%, legal costs, and BSD): approximately S$310,000–S$340,000
-
Cash-on-cash return: approximately 91–100% over 6 years
Buyer B:
-
Total cash and CPF committed (2024): approximately S$370,000 in downpayment plus stamp duties of ~S$35,600 = ~S$405,600
-
Estimated net gain at hypothetical 2026 sale: approximately S$70,000–S$100,000
-
Cash-on-cash return: approximately 17–25% over 2 years
Even annualised, Buyer A’s return (roughly 15–17% per year on cash deployed) significantly outpaced Buyer B’s (roughly 9–12% per year). The combination of lower entry price, lower interest environment, and longer appreciation runway created a compounding advantage that the resale buyer could not replicate.
For context, resale units achieved a 3.7% annualized return historically, according to Business Times, while new private homes had a historical return of 2.7% – but these aggregated figures mask the outsized gains available to early buyers who enter at the sweet spot of developer pricing.
Beyond Price: Risk, Liquidity, and Business Cash Flow Considerations
Numbers tell most of the story, but investors – especially SME owners – must weigh practical factors that spreadsheets alone cannot capture. The data shows Buyer A outperformed, but what risks did that performance require?
Construction and Market Risk for the Early-Bird Buyer
Buyer A accepted meaningful uncertainties:
-
Product risk: The finished unit could differ from showflat expectations. Stack noise, actual views, and workmanship quality were unknowns until TOP.
-
Market risk: Between 2020 and 2024, COVID-19 disrupted supply chains, construction costs escalated, and macro uncertainty triggered cooling measures. The property market could have moved sideways or declined.
-
Completion risk: Delays in construction could extend the waiting period and strain financial plans.
These risks were partially compensated by the early bird price discount and by locking in lower interest rates during the 2020 low-rate window. For OCR mass-market projects with established developers, historical completion risk is lower than boutique developments – but it is never zero, and buyers should exercise greater caution with smaller, untested developers.
Buyer sentiment and initial take-up rates can affect pricing dynamics in real estate – a strong launch weekend (which this project achieved) generally signals robust demand that supports future pricing.
Cash Flow and Business Liquidity for SME or Investor Buyers
For business owners, the progressive payment structure was a smarter move. Buyer A’s payments aligned with anticipated revenue growth over 3.5 years, preserving working capital for:
-
Inventory purchases and supplier payments
-
Hiring during expansion periods
-
Emergency buffers for business volatility
-
Other investment opportunities
Buyer B’s concentrated outlay in 2024 had the opposite effect: a large lump-sum CPF and cash drawdown, followed by immediate monthly instalments approximately 70–90% higher than Buyer A’s equivalent. For a services business owner facing income volatility, this front-loading can constrain reinvestment and reduce holding power during market softness.
Some investors deliberately choose resale because they can rent out or occupy immediately – OCR properties achieve gross rental yields of 4% to 6%, compared with CCR rental yields that typically range between 2.5% and 3.5%. But the rental income must be weighed against the higher acquisition cost and carrying expense. In today’s market, the maths still favoured the early bird.
Exit Liquidity and Buyer Pool at Different Stages
OCR condos at or just after TOP benefit from strong upgrader demand. HDB upgraders – the largest buyer pool in Singapore’s private homes market – overwhelmingly target newly completed OCR units with modern amenities and proximity to MRT stations.
Buyer A’s exit options in 2024–2026:
-
Sell at TOP to the deep pool of HDB upgraders wanting a brand-new ready unit
-
Rent out and wait for 1–2 more years of capital growth, accessing that 4–6% gross yield
-
Move in and transition HDB sale later under applicable rules
-
Hold for long term positioning as the surrounding new precinct develops
Buyer B’s exit options:
-
Narrower margin to discount if the market softens
-
Faces increasing competition from upcoming supply – Singapore’s government land sales added approximately 4,600 units in 2026, feeding the supply pipeline in OCR
-
Future buyer expectations will be shaped by newer projects with more recent designs and features
By buying early, Buyer A gained more exit paths and pricing power. Market momentum and demand can influence resale prospects for new properties, and the early bird’s lower cost base provides a buffer that the resale buyer simply doesn’t have.
Common Mistakes When Comparing New Launch vs Resale in OCR
Many buyers misread headline psf prices or allow buyer psychology – the comfort of seeing a finished product – to override detailed financial analysis. This case study demonstrates why data-driven comparison matters.
Only Looking at Total Price, Not Payment Profile
The error: buyers conclude “resale is safer because I see the product” but ignore the cash flow burden of timing. A S$1.48M resale unit requiring S$370,000 upfront and full servicing at 4% is a fundamentally different financial proposition than a S$1.25M launch unit with staged payments at 1.5%.
Solution: Always chart out year-by-year cash, CPF, and loan servicing for each option before deciding. Build a simple spreadsheet comparing cumulative outlay at each milestone – the difference will often surprise you.
Ignoring Business and Personal Income Volatility
SME owners frequently assume stable income when committing to a large lump-sum purchase. But business revenue can dip – a single quarter of softness in a services business can make high monthly instalments painful.
Solution: Stress-test scenarios where business revenue drops 20–30%. Progressive payments provide more options during downturns because the large tranches (25% at TOP, 15% at legal completion) arrive later, when you’ve had years to prepare. The additional buyer’s stamp duty for foreigners is 60%, and while this primarily affects non-Singaporean purchasers, it is a reminder that stamp duties across the board – including buyer’s stamp duty – must be factored into any stress test.
Assuming All OCR New Launches Offer the Same Upside
Not every launch delivers first mover advantage. Some OCR launches are priced aggressively at day one, and some buyers end up entering at peak prices from the outset, leaving little room for later capital appreciation – developers sometimes set launch prices that already reflect future upside, especially in highly anticipated locations near the greater southern waterfront or Turf City redevelopment.
Solution: Compare the launch price to surrounding resale benchmarks, check the master plan for future supply from GLS sites, and assess whether the developer is pricing for volume (early bird discount) or prestige (premium from day one). Data analytics from platforms like EdgeProp and research from Singapore realtors and Business Times can help validate whether a project truly sits at the sweet spot.
For perspective: 28% of new CCR sales incurred losses over the past decade, while new homes in CCR sold for 41% more than resale units on average. The CCR market and OCR market behave differently – average CCR prices range from S$2,650 to S$3,208 PSF, making the risk-reward calculus distinct from OCR where lower returns are less common but the entry quantum is far more accessible. CCR prices grew 27% from Q3 2020 to Q3 2025, compared with OCR’s 46% surge over a similar period – evidence that OCR has been the stronger performer for capital appreciation in this cycle. Foreign purchases in the CCR dropped to 4.7% in 2026, further illustrating how cooling measures and the ABSD regime have shifted demand dynamics away from luxury properties in the core central region toward OCR projects.
Conclusion and Next Steps
This OCR case study demonstrates that the early-bird new launch buyer outperformed the later resale buyer across every major financial metric:
-
Capital gains: Buyer A achieved approximately 29.6% total appreciation versus Buyer B’s 9.5% over their respective holding periods
-
Cash-on-cash return: Buyer A’s return on cash deployed was roughly 91–100% over six years, compared with Buyer B’s 17–25% over two years
-
Cash flow flexibility: Progressive payments preserved business liquidity across 3.5 years of construction, versus a concentrated cash demand for the resale buyer
This outcome depended on three conditions: sensible launch pricing relative to nearby resale benchmarks, a reasonable holding period through TOP and beyond, and a payment schedule matched to the buyer’s income and business cycle. Not every new launch will replicate these results – the HDB Resale Price Index fell by 0.10% in Q1 2026, reminding us that even established market segments can soften – but the structural advantages of buying early at well-priced OCR launches are supported by data across multiple market cycles. Resales posted stronger returns for properties between 700–1,000 sq ft in the CCR, but in OCR, the new launch early bird consistently has the edge when entry pricing is disciplined. Older leasehold resales had a median return of 23.7%, and while new CCR launches featured lower price quantums in early 2026, the OCR remains the segment where early buyers may benefit from lower prices in initial phases. Early buyers may benefit from lower prices in initial phases – a pattern that held firmly in this case study. The median price gap between CCR and RCR narrowed to 10.1% in 2025, suggesting that regional pricing dynamics continue to shift in ways that reward careful, data-informed analysis.
Your next steps:
-
Map your 5–7 year cash flow and business plans before deciding on launch vs resale. Understand whether your income profile suits progressive payments or whether you need immediate possession.
-
Build a side-by-side financial comparison – entry price, staged payments, projected value, and carrying costs – for any OCR projects you are considering. Request this from your property advisor.
-
Shortlist a few OCR condos (both launches and resales) and compare micro-location, the tenant pool, buyer demographics, and the GLS supply pipeline to assess future upside.
If you would like us at Aesthetic Havens to run custom numbers and project comparisons tailored to your situation – whether you are an upgrader, business owner, or investor – reach out for a personalised analysis.
Additional Resources
For readers who want to replicate this analysis for other projects or deepen their understanding of OCR investment fundamentals:
-
Progressive Payment Schedule Guide: A visual walkthrough comparing staged BUC payments against resale completion statements, with worked examples for OCR units of different sizes
-
OCR New Launch Checklist: Key questions to ask before committing – from developer pricing history and sell-through rates to surrounding resale comparisons and upcoming supply
-
GLS Pipeline and Supply Analysis: Understanding how Singapore’s government land sales programme affects future pricing in your target OCR district, including how approximately 4,600 units added in 2026 may shape the competitive landscape
-
Interest Rate Sensitivity Calculator: A framework for stress-testing your mortgage under different rate scenarios – from the 1.5% lows of 2020 to the 4%+ environment of 2024 and the current three-month compounded SORA rate of approximately 1.23%

