

Introduction: 2026 New Launch PSF Ranking at a Glance
The 2026 new launch PSF ranking reveals a Singapore property market where the price gap between suburban value buys and prime luxury has compressed significantly – yet meaningful differences remain for buyers who know where to look. New launch CCR condos average S$3,208 psf in 2026, RCR new launches average S$2,695 psf, and OCR new launches average S$2,154 psf, creating a full spectrum from roughly S$1,800 to over S$3,400 psf across all 2026 new launches ranked by average PSF from OCR value buys to CCR prestige.
This article covers private non-landed new launch condo transactions recorded via URA developer sales from January to September 2026. Executive condominiums are referenced separately where relevant since they serve eligible buyers under different qualification criteria. The focus is on projects with meaningful transaction volume – generally 30 or more caveated units – to ensure PSF figures reflect actual market pricing rather than outlier deals.
Whether you are a first-time private buyer upgrading from HDB, a yield-focused investor comparing market segments, or a high net worth individual evaluating CCR luxury properties for capital preservation, this ranking gives you the data foundation to compare projects on equal terms. The average selling price for new property launches in Singapore has trended between S$2,582 psf to S$2,690 psf in 2026, but that headline number masks enormous variation by region, tenure, and location quality.
Here is what you will take away:
-
A complete 2026 new launch PSF ranking across CCR, RCR and OCR with project-level data
-
How tenure (freehold vs 99-year), unit mix, and district dynamics shift PSF within each region
-
Worked budget examples converting PSF into total quantum and monthly commitments
-
Where the CCR vs RCR and RCR vs OCR price gaps are narrowing – and where they remain wide
-
Actionable guidance for HDB upgraders, yield investors, and family offices using PSF data for buying strategy
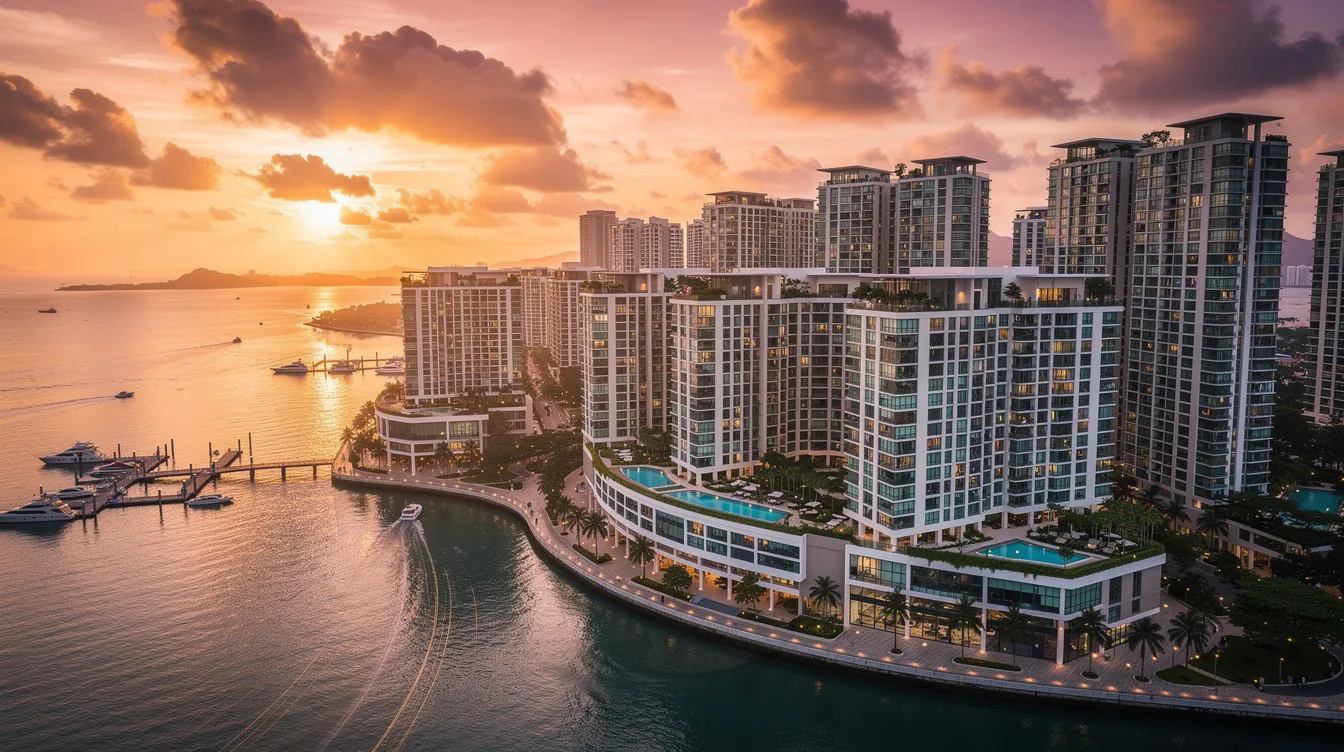
Understanding 2026 New Launch PSF Rankings
Average PSF – price per square foot – is the standard metric for comparing residential developments in the Singapore property market. For 2026 new launches, the figures referenced throughout this article use median transacted PSF from URA developer sales caveats, not asking prices or developer guide ranges. This distinction matters: a project’s launch weekend guide price may differ from the median PSF once multiple stacks and floors are sold over subsequent months. New private residential launches average approximately S$2,123.95 to S$2,582.29 psf overall in 2026, depending on which projects and unit types are included.
For homeowners, PSF helps compare what you are paying relative to unit size across different projects and districts. For investors, PSF is the starting point for calculating entry price, estimating rental yields, and benchmarking against nearby resale private property. However, PSF alone can mislead – total quantum, layout efficiency, and future supply in the micro-market all matter just as much.
The data in this article draws from confirmed URA caveat records supplemented by developer sales reports. To ensure fair comparison, strata landed units, penthouse outliers, and projects with fewer than 30 transacted units are excluded. This normalisation prevents low-volume anomalies from distorting the 2026 new launch PSF ranking.
How CCR, RCR and OCR Shape PSF
URA divides Singapore into three pricing regions – the core central region (CCR), the rest of central region (RCR), and the outside central region (OCR). These boundaries directly determine land cost, buyer profile, and ultimately the PSF that developers must charge to achieve viable margins. The same 800 sq ft two-bedroom unit commands vastly different price points depending on which side of these boundaries it falls.
In 2026, the typical launch PSF bands are:
-
OCR: ~S$1,850–S$2,400 psf for private condos (ECs sit lower, around S$1,400–S$1,550 psf)
-
RCR: ~S$2,300–S$2,900 psf, with premium city-fringe projects stretching above S$2,800
-
CCR: ~S$3,000–S$3,400+ psf, with ultra-prime launches exceeding S$4,000 psf
Pricing pressure in the Singapore property market results from rising land acquisition costs and competition for desirable locations. When a developer wins a government land sales (GLS) site at a high price per plot ratio (PPR), the breakeven PSF for the finished project rises accordingly. For example, a CCR GLS site acquired at S$1,800 PPR needs to sell finished units well above S$3,000 psf to cover construction, financing, and margin – which is exactly why projects in the core central region typically command prices between S$2,800 and S$3,400+ psf in 2026.
Tenure, Unit Mix and Breakeven: Why PSF Differs Project to Project
Tenure is one of the sharpest PSF differentiators in any new launch market:
-
99-year leasehold dominates OCR and most RCR GLS launches. These projects carry lower land cost and thus lower breakeven PSF.
-
Freehold or 999-year tenure appears mainly in CCR and select RCR locations where developers acquire en-bloc sites. A freehold project typically commands a 10–20% PSF premium over a comparable 99-year neighbour.
Unit mix also reshapes median PSF. Smaller one-bedroom and studio units tend to register higher PSF because buyers pay a premium per square foot for compact, lower-quantum entry. Larger three- and four-bedroom family units often show lower PSF but significantly higher total quantum. Some CCR projects like Amberwood at Holland deliberately omit smaller layouts, which concentrates their PSF data around larger-format pricing.
Beyond tenure and size, amenities – direct MRT access, integrated retail, waterfront positioning, proximity to East Coast Park or Marina Bay – push PSF upward. A project like Vela Bay in the OCR achieves near-RCR pricing (~S$2,886 psf) precisely because of its Bayshore waterfront location and lifestyle amenities. Meanwhile, a suburban OCR launch without these features sits closer to the S$2,100–S$2,200 psf floor.
With these foundations clear, the next section presents the actual 2026 rankings from OCR value to CCR prestige.
2026 New Launches Ranked by Average PSF: The Master List
The master list below ranks major 2026 new launches by achieved median PSF, grouped by region. Only projects with at least 30 caveated units between January and September 2026 are included, using URA developer sales data. Average OCR prices range from S$1,650 to S$2,154 psf, while average CCR prices range from S$2,650 to S$3,208 psf – a spread that becomes vivid when you see individual projects side by side.
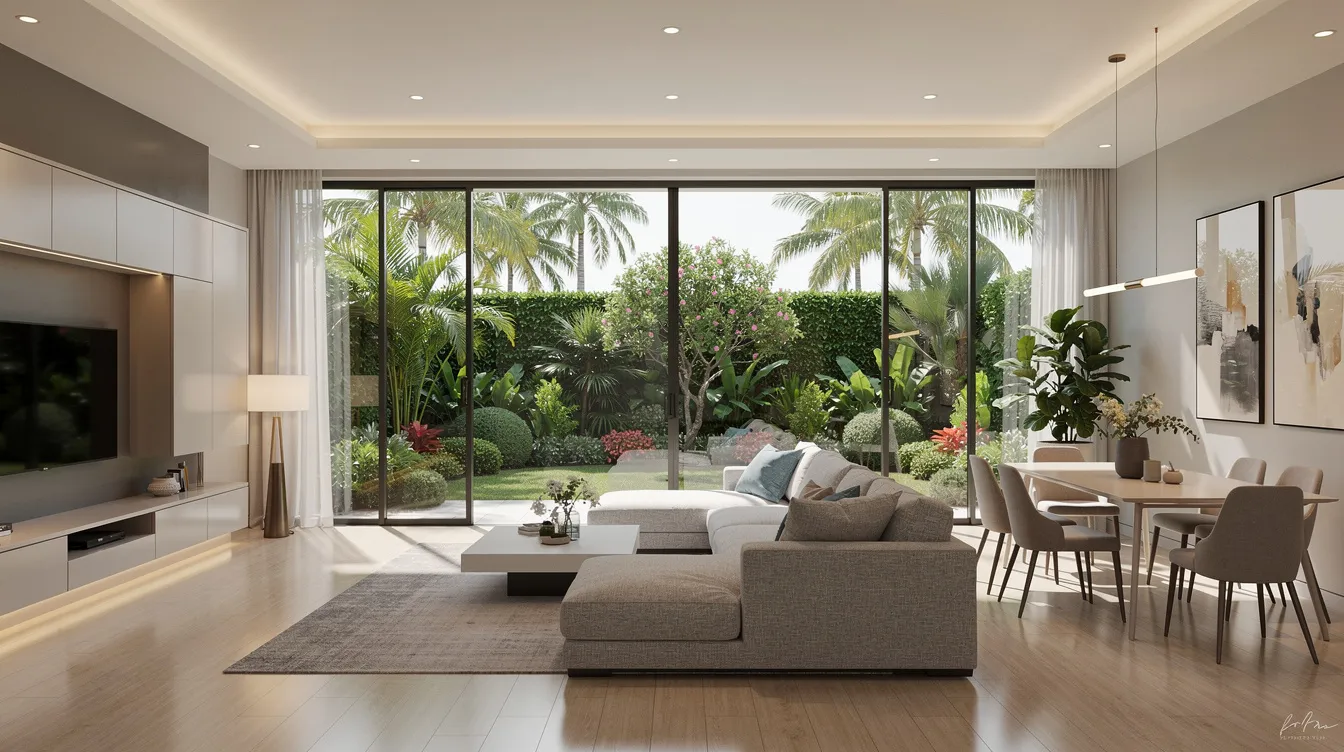
|
Project |
District |
Region |
Tenure |
Median PSF (2026) |
Est. 2-BR Quantum |
Notes |
|---|---|---|---|---|---|---|
|
Coastal Cabana (EC) |
D18 |
OCR |
99-yr |
~S$1,796 |
~S$1.38M |
EC; eligible buyers only |
|
Rivelle Tampines (EC) |
D18 |
OCR |
99-yr |
~S$1,937 |
~S$1.45M |
EC; near Thomson East Coast Line |
|
Tengah Garden Residences |
D24 |
OCR |
99-yr |
~S$2,120 |
~S$1.55M |
Near Jurong Region Line; 99% sold |
|
Narra Residences |
D23 |
OCR |
99-yr |
~S$2,180 |
~S$1.60M |
Bukit Batok West fringe |
|
Lentor Gardens Residences |
D26 |
OCR |
99-yr |
~S$2,348 |
~S$1.75M |
Lentor MRT; competitive corridor |
|
Pinery Residences |
D18 |
OCR |
99-yr |
~S$2,546 |
~S$1.90M |
Tampines West; 92.5% sold at launch |
|
Terra Hill |
D5 |
RCR |
Freehold |
~S$2,209 |
~S$1.70M |
Pasir Panjang; freehold project |
|
The Sen |
D21 |
RCR |
99-yr |
~S$2,386 |
~S$1.80M |
Upper Bukit Timah fringe |
|
Hudson Place Residences |
D5 |
RCR |
99-yr |
~S$2,483 |
~S$1.90M |
Clementi/West Coast |
|
The Continuum |
D15 |
RCR |
Freehold |
~S$2,716 |
~S$2.10M |
East Coast; freehold |
|
Vela Bay |
D16 |
OCR* |
99-yr |
~S$2,886 |
~S$2.20M |
Bayshore waterfront; premium OCR |
|
Union Square Residences |
D1 |
RCR |
99-yr |
~S$2,813 |
~S$2.15M |
Mixed use development near CBD |
|
Amberwood at Holland |
D10 |
CCR |
Freehold |
~S$3,020 |
~S$2.50M |
Holland; no small units |
|
Dunearn House |
D11 |
CCR |
Freehold |
~S$3,105 |
~S$2.60M |
Bukit Timah; ~380 units |
|
River Modern |
D9 |
CCR |
99-yr |
~S$3,266 |
~S$2.70M |
River Valley; ~90% sold at launch |
|
Newport Residences |
D2 |
CCR |
Freehold |
~S$3,370 |
~S$2.80M |
Tanjong Pagar; freehold |
*Vela Bay is technically OCR but priced at RCR-equivalent levels due to waterfront premium.
The full PSF spread between the most accessible OCR launch (Coastal Cabana EC at ~S$1,796) and the priciest CCR project (Newport Residences at ~S$3,370) is approximately S$1,574 psf. Even excluding ECs, the gap between Tengah Garden Residences (~S$2,120) and Newport (~S$3,370) is over S$1,250 psf – roughly a 59% premium for CCR prestige over OCR value. New launch supply is expected to drop 30% year-on-year in 2026, which has kept pricing firm across all three regions.
Quick Snapshot: OCR vs RCR vs CCR 2026 New Launch PSF
|
Metric |
OCR |
RCR |
CCR |
|---|---|---|---|
|
2026 Median New Launch PSF |
~S$2,154 |
~S$2,695 |
~S$3,208 |
|
Lowest-PSF Project |
Coastal Cabana (~S$1,796) |
Terra Hill (~S$2,209) |
Amberwood at Holland (~S$3,020) |
|
Highest-PSF Project |
Vela Bay (~S$2,886) |
Union Square Residences (~S$2,813) |
Newport Residences (~S$3,370) |
|
Typical 2-BR Quantum |
~S$1.38M–S$1.90M |
~S$1.70M–S$2.15M |
~S$2.50M–S$2.80M |
Key observations:
-
The OCR floor for private condos now sits above S$2,100 psf for most launches – the typical entry price for new launches in the outside central region starts from roughly S$1.38 million
-
RCR’s upper band (~S$2,800+) overlaps with lower CCR projects, creating a compressed CCR vs RCR gap in some corridors
-
CCR still sets top-end benchmarks well above S$3,200 psf, with select ultra-prime launches exceeding S$4,000 psf
-
64% of new launches in 2026 will be in OCR, reflecting developer focus on suburban demand and family-oriented design
With the full ranking established, the following sections break down each region in detail – starting with OCR value buys and moving toward CCR prestige.
OCR Value Buys: 2026 New Launches with the Lowest PSF
The outside central region OCR is where most HDB upgraders and budget-conscious investors begin their new launch search. OCR new launches average S$2,154 psf in 2026, and while that figure has crept upward from 2025, OCR prices still represent the most accessible entry point into Singapore’s private market. OCR prices surged 46% from 2020 to 2025, outpacing even CCR price growth, which means today’s “value” is relative – but compared to RCR and CCR, OCR remains the most affordable segment by a wide margin.
By 2026, property buyers in the OCR prioritize larger homes with transport access at a lower price than prime-central developments. New launches in the outside central region focus heavily on suburban growth and family-oriented design – projects tend to offer more generous layouts, and three-bedroom units are often the volume seller rather than compact one-bedrooms.
Lowest-PSF OCR Launches in 2026 (Shortlist and Stats)
Here are the standout OCR value buys ranked from lowest to highest PSF:
-
Coastal Cabana (EC, D18): Median PSF ~S$1,796 | Entry 3-BR from ~S$1.38M | 99-year | Near Tampines MRT (Downtown Line) | Low PSF reflects EC pricing structure – executive condominiums provide a more affordable alternative and start around S$1,400 to S$1,550 psf. Over 415 units sold.
-
Rivelle Tampines (EC, D18): Median PSF ~S$1,937 | Entry 3-BR from ~S$1.45M | 99-yr | Proximity to Thomson East Coast Line station | EC eligibility cap keeps PSF lower; ~92.5% taken up at launch.
-
Tengah Garden Residences (D24): Median PSF ~S$2,120 | Entry 2-BR from ~S$1.55M | 99-yr | Near future Jurong Region Line station | Precinct is still maturing; 99% of units sold, showing strong demand despite early-precinct risk.
-
Narra Residences (D23): Median PSF ~S$2,180 | Entry 2-BR from ~S$1.60M | 99-yr | Bukit Batok West fringe | PSF reflects location further from established amenities; attractive entry price for families willing to wait for precinct development.
-
Lentor Gardens Residences (D26): Median PSF ~S$2,348 | Entry 2-BR from ~S$1.75M | 99-yr | 5-min walk to Lentor MRT (Cross Island Line connection coming) | Competitive corridor with multiple projects launching – supply overhang tempers PSF.
-
Pinery Residences (D18, Tampines West): Median PSF ~S$2,546 | Entry 2-BR from ~S$1.90M | 99-yr | Near nearest MRT station on Downtown Line | Higher PSF for OCR but justifiable by integrated amenities; 92.5% sold at launch weekend.
Where OCR Value is Real vs “Cheap for a Reason”
Signs of genuine value:
-
Upcoming MRT connectivity: projects near the Jurong Region Line, Cross Island Line extensions, or Thomson East Coast Line stations benefit from future price growth as infrastructure arrives
-
URA Master Plan catalysts: areas like Jurong Lake District, Tengah, and Defu are earmarked for significant commercial and residential transformation
-
Strong school catchment and neighbourhood amenities that support strong rental demand from families
Red flags to watch:
-
Supply-heavy corridors: the Lentor corridor now has multiple competing launches with similar TOP timelines (2028–2031), which could suppress resale appreciation
-
Limited employment drivers: some low-PSF OCR precincts lack nearby business parks or commercial hubs, which weakens the rental market
-
Projects far from established town centres where daily conveniences require driving rather than walking
Who these suit: OCR value buys are best suited for first-time private buyers upgrading from HDB, long-term owner-occupiers with 7–10+ year horizons, and investors seeking higher OCR gross rental yields of 4.0% to 6.0% at an accessible entry point.
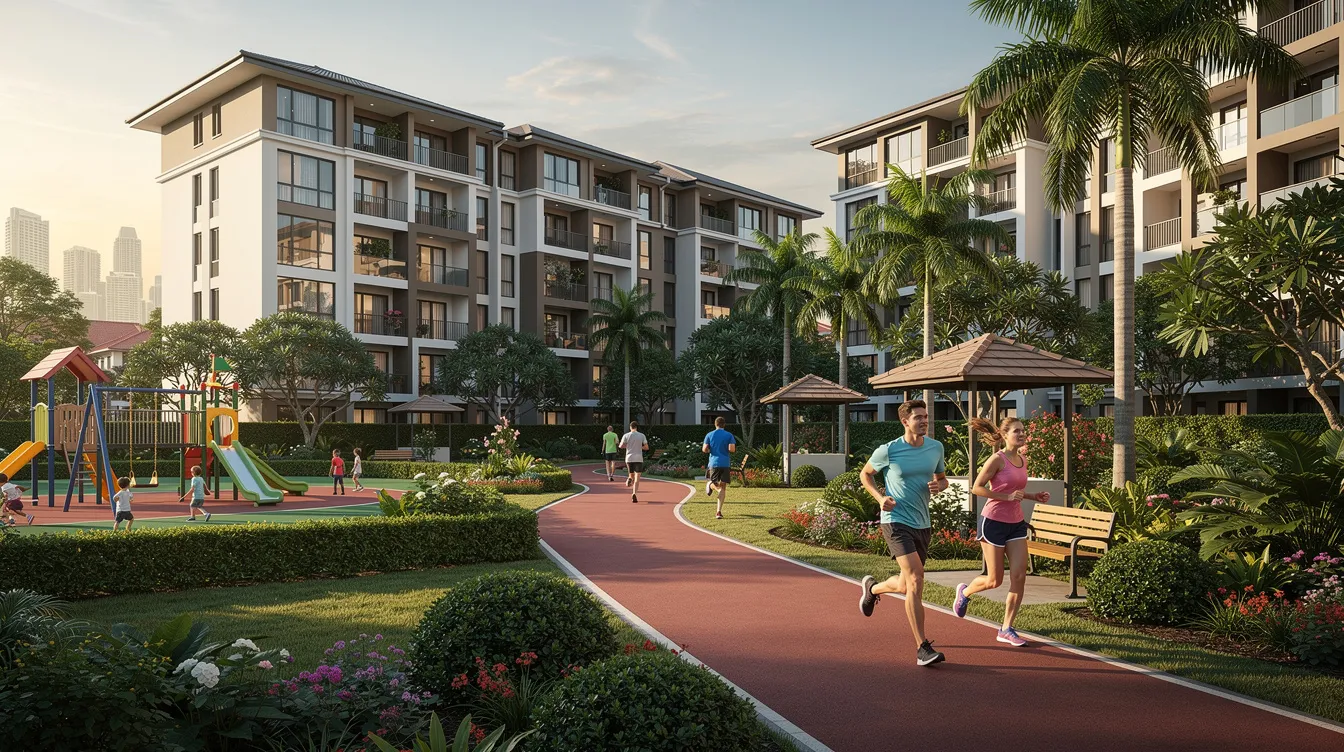
RCR Sweet Spot: Mid-Tier 2026 Launches Balancing Price and Proximity
The rest of central region occupies the city-fringe middle ground in the 2026 launch market – offering proximity to the CBD without full CCR quantum. RCR new launches average S$2,695 psf in 2026, and the band stretches from ~S$2,200 at the fringe to above S$2,800 for premium projects near CBD boundaries. Some top-end RCR projects now overlap with lower CCR launches in PSF, which makes the CCR vs RCR comparison increasingly nuanced.
RCR’s appeal lies in city fringe convenience: most RCR projects are within 15–25 minutes of the CBD by MRT, in districts with established amenities, diverse food and retail, and robust white-collar tenant pools.
2026 RCR Launches: Ranked by PSF from Fringe Value to Premium Fringe
-
Terra Hill (D5, Pasir Panjang): Freehold | Median PSF ~S$2,209 | Typical 3-BR ~S$2.1M | Near Circle Line; advantage of freehold tenure in a largely leasehold RCR corridor. Low PSF for a freehold project makes it a standout value play.
-
The Sen (D21, Upper Bukit Timah): 99-yr | Median PSF ~S$2,386 | Typical 3-BR ~S$2.3M | Near Downtown Line; positioned between established Bukit Timah estates and emerging growth nodes. Good connectivity but competes with nearby launches.
-
Hudson Place Residences (D5, West Coast): 99-yr | Median PSF ~S$2,483 | Typical 3-BR ~S$2.4M | Clementi/West Coast fringe with direct access to one-north and Media Circle business hubs. Appeals to tech sector tenants.
-
The Continuum (D15, East Coast): Freehold | Median PSF ~S$2,716 | Typical 3-BR ~S$2.6M | Near East Coast Park and established D15 amenities. Freehold tenure and mature estate character support long-term capital appreciation.
-
Union Square Residences (D1): 99-yr | Median PSF ~S$2,813 | Typical 2-BR ~S$2.15M | Mixed use development with direct MRT access near Marina Bay. PSF approaches CCR territory due to CBD-edge positioning.
The gap between entry-level RCR (Terra Hill at ~S$2,209) and upper-tier OCR (Pinery at ~S$2,546) is remarkably thin – only about S$337 psf difference, and Pinery is technically OCR. This compression shows how some OCR launches are rapidly approaching RCR price points when they offer premium positioning.
How to Read RCR PSF: Is the Premium Justified?
Why RCR PSF premiums over OCR can be rational:
-
Shorter CBD commute times (typically 15–25 min vs 35–50 min for deeper OCR) support higher rents and stronger tenant demand
-
White-collar tenant pools near business districts like one-north, Media Circle, and Paya Lebar create resilient rental market conditions
-
Freehold pockets in RCR (e.g. D5, D15) offer tenure advantages rarely found in OCR
-
Established neighbourhoods with mature amenity ecosystems reduce “early precinct” risk
When RCR PSF may be stretched:
-
Heavy new supply in specific corridors (e.g. one-north / Media Circle fringe, Paya Lebar) where multiple projects launching simultaneously can pressure both rents and resale values
-
Compact units with high PSF but limited livability – some one-bedroom RCR units achieve S$2,800+ psf but offer only 450–500 sq ft of usable space
-
RCR projects priced at CCR-adjacent levels (above S$2,800) in districts without the prestige or amenity depth to sustain that premium long term
Ideal RCR buyer profiles: Professionals wanting a 20–30 minute commute, investors seeking strong rental demand in established tenant corridors, and business owners looking to house staff near key commercial hubs.
CCR Prestige: 2026 Launches Setting the Highest PSF
New launch CCR condos average S$3,208 psf in 2026, with select ultra-prime launches in Orchard, Marina Bay, and Sentosa pushing well beyond S$4,000 psf. CCR prices grew 20.7% from 2020 to 2025, but the CCR market has shown signs of stabilisation following cooling measures – particularly the 60% additional buyer’s stamp duty imposed on foreign buyers, which has fundamentally reshaped CCR demand. Foreign buyer participation declined by approximately 60% year-on-year, making domestic and PR demand the primary driver of CCR properties.
Projects in the core central region typically command prices between S$2,800 and S$3,400+ psf in 2026, with ultra-luxury launches exceeding these ranges. Despite the elevated PSF, certain CCR launches offer “relative value” when compared to peak ultra-prime pricing – and understanding which CCR projects sit where on the spectrum is essential for any serious buyer.
Top-PSF CCR Launches in 2026: From Luxury Prime to Ultra-Prime
-
Amberwood at Holland (D10): Freehold | Median PSF ~S$3,020 | Smallest 2-BR from ~S$2.50M | Holland Village address with proximity to lifestyle amenities and international schools. Slower take-up (~11% at initial release) suggests buyer caution at this quantum despite strong location quality. Developer track record matters at this price level.
-
Dunearn House (D11): Freehold | Median PSF ~S$3,105 | ~380 units | Entry 2-BR from ~S$2.60M | Bukit Timah heritage district; appeals to families seeking space in an established, low-density precinct. Freehold project status supports long-term capital preservation.
-
River Modern (D9): 99-yr | Median PSF ~S$3,266 | Near River Valley and Robertson Quay | ~90% sold at launch – the strongest take-up of any 2026 CCR project. The combination of a well-known river valley address and competitive (by CCR standards) quantum drove demand.
-
Newport Residences (D2): Freehold | Median PSF ~S$3,370 | Tanjong Pagar | Direct access to CBD employment; freehold tenure rare for new launches in D2. Total quantum is high but underwritten by proximity to Marina Bay and the Greater Southern Waterfront transformation.
-
Ultra-prime launches (Orchard/Marina Bay corridor): Select launches along Marina Gardens Lane and Orchard Boulevard have tested S$4,000+ psf, targeting high net worth individuals, family offices, and the remaining foreign investors willing to absorb the 60% ABSD.
The PSF premium of CCR over RCR varies significantly by project. River Modern (~S$3,266) sits only ~S$450 above Union Square Residences (~S$2,813) – a compressed CCR vs RCR gap of about 16%. Meanwhile, Newport at ~S$3,370 represents over S$1,100 more per square foot than Terra Hill (~S$2,209) – a gap that reflects the full distance between fringe RCR and prime CCR. The CCR-OCR price gap narrowed to 16.3% in 2025, and while it has widened slightly in 2026, the trend of convergence remains notable.
Who Should Pay CCR PSF in 2026 (and Who Shouldn’t)
CCR PSF makes sense for:
-
High net worth individuals and family offices treating property as wealth preservation – freehold CCR addresses historically hold value through cycles
-
Business owners who derive lifestyle and professional utility from a prime address (entertainment, proximity to legal and financial services)
-
Buyers with long holding horizons (10+ years) who can absorb short-term mark-to-market fluctuations and do not require strong rental yields for cashflow
CCR PSF may not be rational for:
-
Yield-focused investors operating under tight total debt servicing ratio constraints – CCR rental yields range from 2.5% to 3.5%, which may not cover mortgage costs on highly leveraged purchases
-
Buyers who would need to over-leverage to enter CCR, especially given TDSR limits capped at 55% of gross income
-
Those who could achieve similar lifestyle outcomes in high-specification RCR projects at 20–30% lower PSF
The median price in the Core Central Region for small units is around S$2,420+ psf – showing that even CCR’s most “entry-level” options carry substantial quantum. High-end CCR rents grew by 1.8% recently and rental yields in CCR increased by 2.7% annually, but these growth rates start from a lower yield base than OCR or RCR.
Turning PSF into Real Numbers: Budget and Monthly Commitments
PSF is an abstraction until you convert it into purchase price, stamp duties, and monthly commitments. A S$200 psf difference across an 800 sq ft unit translates to S$160,000 in total quantum – enough to change your financing profile entirely.
Here is a quick reference for typical quantum at three PSF levels for a 2-bedroom unit of approximately 750 sq ft:
|
PSF Level |
Region Example |
Total Price (750 sq ft) |
BSD (SC 1st property) |
25% Downpayment |
Est. Monthly Instalment* |
|---|---|---|---|---|---|
|
S$2,100 |
OCR (Tengah Garden) |
~S$1.575M |
~S$39,950 |
~S$393,750 |
~S$6,300 |
|
S$2,600 |
RCR (Hudson Place) |
~S$1.950M |
~S$54,950 |
~S$487,500 |
~S$7,800 |
|
S$3,200 |
CCR (Dunearn House) |
~S$2.400M |
~S$74,950 |
~S$600,000 |
~S$9,600 |
*Based on ~3.5% interest rate over 25 years. Excludes ABSD (applicable for 2nd property onwards) and renovation costs.
Total acquisition costs include stamp duties and legal fees. Cash requirements add 4% to 9% above the purchase price when factoring in buyer’s stamp duty, legal fees, and renovation costs. For a S$1.8M OCR purchase, expect roughly S$72,000–S$162,000 in additional costs; for a S$3.0M CCR purchase, that rises to S$120,000–S$270,000.
Foreign buyers face a 60% additional buyer’s stamp duty – meaning a S$3.0M CCR unit would attract S$1.8M in ABSD alone, which has effectively removed most foreign investors from the private market at all but the ultra-luxury tier. The ABSD for foreigners is currently 60% on residential purchases.
Worked Examples: OCR vs RCR vs CCR Purchase Side by Side
Example 1: Lentor Gardens Residences (OCR, D26)
-
2-BR, ~750 sq ft at S$2,348 psf = ~S$1.761M total
-
BSD (SC 1st property): ~S$47,440
-
25% downpayment: ~S$440,250 (min 5% cash = S$88,050)
-
Monthly instalment (25 yr, 3.5%): ~S$7,050
-
Expected gross rental: ~S$3,800–S$4,200/month (yield ~2.6–2.9% – lower for new vs resale; OCR properties achieve gross rental yields of 4.0% to 6.0% typically for well-located resale)
Example 2: The Continuum (RCR, D15)
-
2-BR, ~750 sq ft at S$2,716 psf = ~S$2.037M total
-
BSD: ~S$59,480
-
25% downpayment: ~S$509,250
-
Monthly instalment: ~S$8,150
-
Expected gross rental: ~S$4,200–S$4,600/month (RCR rental yields are lower than OCR but higher than CCR)
Example 3: Newport Residences (CCR, D2)
-
2-BR, ~750 sq ft at S$3,370 psf = ~S$2.528M total
-
BSD: ~S$79,600
-
25% downpayment: ~S$632,000
-
Monthly instalment: ~S$10,100
-
Expected gross rental: ~S$5,000–S$5,500/month (CCR yield ~2.5–2.7%)
Key comparisons:
-
The upfront cash/CPF gap between the OCR and CCR example is approximately S$192,000 in downpayment alone
-
Monthly instalment difference between OCR and CCR is ~S$3,050 – over S$36,600 per year
-
Despite higher absolute rent in CCR, the yield-to-instalment ratio favours OCR and mid-tier RCR for cashflow-sensitive investors
Comparing 2026 New Launch PSF by Region and District
Beyond individual projects, certain districts within each region consistently cluster as “high PSF” or “value PSF” zones. Prices of new property launches in Singapore are influenced by regional market dynamics and economic conditions, but district-level patterns reveal where micro-market forces are strongest.
|
District |
Region |
Avg 2026 New Launch PSF |
Representative Launch |
Key Character |
|---|---|---|---|---|
|
D9 (River Valley, Orchard fringe) |
CCR |
~S$3,251 |
River Modern |
Prime River Valley; mixed commercial/residential |
|
D10 (Holland, Tanglin) |
CCR |
~S$2,976 |
Amberwood at Holland |
Established prestige; international schools |
|
D11 (Bukit Timah) |
CCR |
~S$3,105 |
Dunearn House |
Heritage estates; family-oriented |
|
D2 (Tanjong Pagar) |
CCR |
~S$3,370 |
Newport Residences |
CBD edge; Greater Southern Waterfront |
|
D15 (East Coast) |
RCR |
~S$2,716 |
The Continuum |
Lifestyle corridor near East Coast Park |
|
D5 (Pasir Panjang, West Coast) |
RCR |
~S$2,209–S$2,483 |
Terra Hill / Hudson Place |
One-north proximity; freehold pockets |
|
D1 (CBD/Tanjong Pagar edge) |
RCR |
~S$2,813 |
Union Square Residences |
Integrated; near Marina Bay |
|
D26 (Lentor/Yio Chu Kang) |
OCR |
~S$2,348 |
Lentor Gardens Residences |
Emerging precinct; Cross Island Line |
|
D18 (Tampines/Pasir Ris) |
OCR |
~S$1,796–S$2,546 |
Coastal Cabana / Pinery |
Wide range; EC floor to integrated premium |
|
D24 (Tengah/Jurong East) |
OCR |
~S$2,120 |
Tengah Garden Residences |
New town; Jurong Region Line coming |
Where the Gaps are Narrowing – and Where They’re Still Wide
-
CCR–RCR gap compression: In some corridors the gap is now below 15%. Union Square Residences (RCR, ~S$2,813) is only ~S$207 below Amberwood at Holland (CCR, ~S$3,020). Buyers evaluating CCR vs RCR in these overlapping zones should weigh freehold status, address prestige, and rental yield differences rather than PSF alone.
-
OCR–RCR gap compression for premium OCR: Vela Bay (~S$2,886 in OCR) actually exceeds several RCR launches in PSF. Integrated or waterfront OCR projects are pushing past traditional RCR entry pricing, making “region” a less reliable proxy for value.
-
Gaps still wide at the extremes: Tengah Garden Residences (~S$2,120 OCR) vs Newport Residences (~S$3,370 CCR) represents a 59% PSF premium – over S$1,250 per square foot – reflecting the enduring price separation between suburban 99-year and prime freehold.
-
Risk of overpaying: Buying RCR at CCR-like PSF in an unproven micro-market (e.g. a new corridor without established amenities) carries downside risk if private home prices soften. Similarly, paying near-RCR PSF for an OCR project in a supply-heavy precinct may not deliver the price growth expected.
Using 2026 PSF Rankings to Shape Your Buying Strategy
PSF rankings are one input – not the whole picture. Your optimal strategy depends on holding period, rental plans, portfolio composition, and personal lifestyle needs. The Singapore government signaled no new cooling measures unless prices exceed 10%, which provides some policy stability backdrop for 2026 decisions.
For HDB Upgraders and First-Time Private Buyers
-
Compare OCR vs entry-level RCR carefully: A Lentor Gardens Residences unit at S$2,348 psf vs a Terra Hill unit at S$2,209 psf shows that entry-level RCR can actually match or undercut upper OCR – and Terra Hill is freehold. First time private buyers should not automatically default to OCR without checking RCR alternatives.
-
Weigh space against location: OCR launches generally offer larger units at lower quantum. If your priority is a three-bedroom for a growing family, OCR value buys like Tengah Garden or Narra Residences deliver more square footage per dollar. But if commute time and tenant demand matter (for future rental), a compact RCR two-bedroom may serve better.
-
Choose integrated projects when possible: Mid-PSF OCR launches with direct MRT access and mixed-use retail (Pinery-type) command higher PSF but deliver significantly better day-to-day convenience than cheaper standalone projects.
-
Before committing: Compare the new launch PSF to resale condos in the same district, check the URA Master Plan for future development, and map your commute and school catchment. HDB resale prices fell by 0.10% in Q1 2026, the first decline since 2019 – which may affect your existing flat’s sale proceeds.
For Investors Focused on Yield and Exit Liquidity
-
Combine PSF with expected rent: OCR properties achieve gross rental yields of 4.0% to 6.0%, while CCR delivers 2.5%–3.5%. For a S$2.0M OCR purchase yielding 4.5%, annual gross rent is ~S$90,000; a S$3.0M CCR purchase at 3.0% yields the same S$90,000 – with S$1.0M more capital locked up.
-
Target mid-PSF projects in strong tenant belts: Launches near MRT nodes and business parks (one-north/Media Circle, Tampines Regional Centre, Jurong Lake District) offer better yield profiles than the cheapest absolute PSF in isolated suburban precincts. Strong rental demand correlates more with employment proximity than low entry price.
-
Plan your exit: Choose projects with diversified unit mix and limited competing future supply near their expected TOP date (2029–2032). Precincts where GLS reserve lists show additional confirmed sites may face resale competition that pressures private home prices. Check URA’s GLS programme for pipeline visibility.
-
Developers sold 1,915 new homes in CCR in 2025 – and with lower 2026 launch volume, CCR scarcity could support capital appreciation over the medium term for well-selected projects.
For High-Net-Worth Buyers and Family Offices
-
Find “relative-value” CCR: Not all CCR is ultra-prime. Projects like Dunearn House (~S$3,105 psf freehold) offer entry into the core central region at significantly below the S$3,400+ ceiling. These represent accessible CCR price points with genuine capital preservation characteristics.
-
Blend residential with commercial/industrial: Diversifying across asset classes – pairing a CCR residential hold with industrial or commercial property investments – can balance yield (industrial often delivers 5–7% gross) against CCR’s lower yield but higher appreciation potential.
-
Stress-test PSF against alternatives: At S$3,200 psf, a single CCR three-bedroom costs approximately S$4.5M. The same capital could acquire two OCR two-bedroom units at ~S$2,100 psf (~S$3.15M combined) with capital to spare for stamp duties – delivering higher aggregate rental yield, though with more management complexity. Under ABSD constraints (17% for SC 2nd property), the two-unit strategy carries significantly higher upfront duty.
Common Pitfalls When Reading 2026 PSF Tables (and How to Avoid Them)
PSF tables are powerful comparison tools, but they can mislead when interpreted without context. The following pitfalls are consistently observed among 2026 buyers navigating the new launch market.
Problem 1: Chasing the Lowest PSF Without Checking Layout and Quantum
-
A low PSF on a 1,200 sq ft three-bedroom still means a total quantum of S$2.5M+ – which may be higher than a compact 650 sq ft two-bedroom in the same project at higher PSF but only S$1.4M total. PSF and quantum can move in opposite directions.
-
Small “shoebox” units of 400–500 sq ft often register the highest PSF in any project because buyers pay a per-sqft premium for lower absolute entry price – but these units may have limited resale appeal and weaker capital appreciation.
-
Solution: Always cross-check PSF with total quantum for your target unit size. Compare usable layout (efficient dumbbell layouts vs long corridor plans) and compass orientation, not just headline PSF.
Problem 2: Ignoring Future Supply and GLS Pipeline Around Low-PSF Launches
-
Some of the lowest OCR prices in 2026 exist precisely because developers are competing for buyers in supply-heavy corridors. The Lentor precinct, for example, now has multiple residential developments from different developers with similar TOP timelines – future supply risk is material.
-
Similarly, precincts with confirmed GLS reserve list sites may see additional launches in 2027–2028 that compete directly with 2026 purchases at resale.
-
Solution: Check URA GLS confirmed and reserve lists. Map TOP timelines of competing sites in a 1km radius. Prefer OCR projects with limited future land parcels nearby, or where government land sales allocation is already largely committed.
Problem 3: Over-Relying on Indicative Prices Before Actual Launch
-
Several anticipated 2026 launches circulated indicative PSF guides that shifted significantly once actual units sold. Pre-launch guides are marketing anchors, not confirmed pricing.
-
The difference between a developer’s e-brochure guide PSF and the URA-recorded median can be 3–8%, depending on which stacks and floors sell first.
-
Solution: Treat pre-launch price guides as ranges with a 3–5% upward buffer. Wait for at least one month of URA caveat data before treating any project’s PSF as confirmed. Build a financing buffer that accommodates this potential variance. LTV ratios for HDB properties are now 75%, down from 80% – so if you are selling HDB to fund your purchase, factor in the tighter loan ceiling.
Conclusion and Next Steps
The 2026 new launch PSF ranking confirms that OCR is no longer “cheap,” RCR is repricing rapidly as a fast-moving sweet spot, and CCR continues to command premium pricing – but with compressed gaps that make cross-region comparisons more important than ever. The Singapore property market features a distinct separation between value-oriented launches in the OCR and luxury offerings in the CCR, yet the boundaries are blurring as premium OCR projects test RCR pricing and RCR launches approach CCR territory.
Key takeaways:
-
OCR median PSF of ~S$2,154 offers the most accessible entry price, but premium OCR launches already exceed S$2,500 psf
-
RCR at ~S$2,695 median PSF represents the strongest balance of location, yield, and capital appreciation potential for most buyer profiles
-
CCR at ~S$3,208 median PSF remains the preserve of wealth preservation, prestige, and long-hold strategies – not yield maximisation
-
Tenure, district, future supply, and unit mix all shift PSF meaningfully within each region – blanket regional comparisons are insufficient
Actionable next steps:
-
Shortlist 5–7 launches by PSF and region from the master list above, filtering for your target unit type and budget
-
Run affordability checks using total quantum (not just PSF) against your TDSR ceiling and available cash/CPF
-
Compare shortlisted new launches against resale private condo options in the same district to assess the new-launch premium
-
Map each shortlisted project against future supply (GLS pipeline, nearby launches with similar TOP dates)
-
Consult a property advisor for portfolio-level analysis – especially if you hold or are considering industrial, commercial, or multiple residential assets where ABSD and diversification strategy intersect
For business owners and investors seeking a customised PSF and yield mapping across selected 2026 residential launches – integrated with industrial and commercial asset analysis – reach out to AESTHETIC HAVENS for a data-driven portfolio review tailored to your acquisition goals.
Frequently Asked Questions on 2026 New Launch PSF Rankings
What is a “good” PSF for a 2026 new launch in OCR, RCR and CCR?
-
In OCR, a “good” PSF in 2026 falls between S$2,000–S$2,300 for private condos with solid MRT connectivity and established precinct amenities. Average new launch prices in OCR range from S$1,600 to S$2,300 psf depending on location and tenure.
-
In RCR, S$2,400–S$2,700 represents fair value for well-located city-fringe launches. Above S$2,800, scrutinise whether the location truly justifies near-CCR pricing.
-
In CCR, anything below S$3,100 psf for a freehold or well-located 99-year project can be considered “relative value” within the segment. CCR demand is primarily driven by domestic buyers post-ABSD changes.
-
Benchmark against nearby resale condos: a 10–20% premium for a new launch over resale in the same district is typical and generally rational.
Are 2026 new launches overpriced compared to resale condos?
-
New launches typically carry a 10–20% premium over nearby resale equivalents, reflecting newer design, longer lease runway, and developer warranties. When the premium exceeds 25%, buyers should question whether the gap will close before their intended exit.
-
In some OCR precincts, the new-launch premium is smaller (8–15%) because resale supply is limited in newer estates like Tengah or Lentor.
-
In CCR, the new-launch premium can be larger (15–25%) because developers build in high land cost recovery, branded finishes, and luxury positioning.
How often do PSF numbers change after launch weekend?
-
Median PSF typically evolves over 2–3 months as different floor levels, stacks, and unit types are released. Launch weekend figures often reflect “best value” stacks sold first, with higher floors and premium facings pushing median PSF upward over time.
-
URA updates caveat data monthly; track the moving median rather than anchoring to a single headline number from launch weekend.
Should investors prioritise PSF or rental yield in 2026?
-
Neither in isolation. A low-PSF project in a weak rental belt delivers poor yield despite attractive entry price. Conversely, a high-PSF CCR unit in a strong expat corridor may deliver acceptable yield but requires far more capital.
-
The most effective approach: screen by PSF to set your budget, then layer rental yield estimates and vacancy data to identify the best risk-adjusted return. OCR properties generally deliver the highest gross yields, but CCR offers stronger capital preservation.
-
Rental yields in CCR increased by 2.7% annually, showing that even the premium segment is seeing rental recovery – but from a lower base.
How does AESTHETIC HAVENS help interpret PSF data for portfolio decisions?
-
Side-by-side PSF and yield comparisons across shortlisted launches in all three market segments
-
Integration of residential purchase analysis with industrial and commercial property holdings for diversified portfolio construction
-
Scenario planning across 5–10 year holding periods, factoring in projected supply, lease decay (for 99-year), and precinct transformation timelines
-
ABSD and financing optimisation for buyers holding multiple properties or considering investment advice on cross-asset allocation

