

Introduction
GLS land prices are the single most transparent data point available to Singapore property buyers months-sometimes over a year-before a showflat opens. If you understand how to read a Government Land Sales tender result and layer realistic costs on top, you can estimate the launch PSF of an upcoming project with surprising accuracy. The method is straightforward: take the awarded land psf ppr from URA, add realistic hard and soft costs, then apply a typical 15–20% developer’s margin to arrive at an indicative launch price range.
This article focuses on Singapore private residential GLS sites, with side notes on Executive Condominiums, using 2025–2026 land tenders and construction cost benchmarks. It is not a guide for overseas markets, detailed tax structuring, or investment advice on specific units. The target readers are serious homebuyers, upgraders, and investors in Singapore who want to evaluate future launches before marketing begins-as well as business owners watching nearby GLS sites that may reshape staff housing demand or neighbourhood pricing.
Why does this matter? Because land cost typically accounts for about 70% of selling price. When a developer pays a record land bid for a site, the breakeven price is essentially locked in. Being able to turn that psf ppr figure into an estimated launch PSF lets you decide early whether to prepare funds, sell an existing property, or redirect your search-long before the glossy brochures arrive.
Here is what you will take away from this article:
-
How to read and interpret URA GLS tender results, including psf ppr, bid count, and winning bid details
-
How to build a full cost stack from land psf ppr through construction, financing, and marketing to breakeven PSF
-
Rule-of-thumb launch PSF bands for the outside central region (OCR), city fringe (RCR), and central region (CCR)
-
A worked example using a real site to walk through the calculation line by line
-
How to cross-check your estimate against resale benchmarks and your own affordability
Understanding GLS Land Price, PSF And PSF PPR
Before diving into the prediction method, you need a firm grip on three things: how Government Land Sales work, what “psf” means to a buyer versus what “psf ppr” means in a land tender, and why launch prices always sit far above the land rate. These distinctions are not academic-confusing them is the most common reason buyers misjudge whether a new launch represents a good deal or an overpriced entry point.
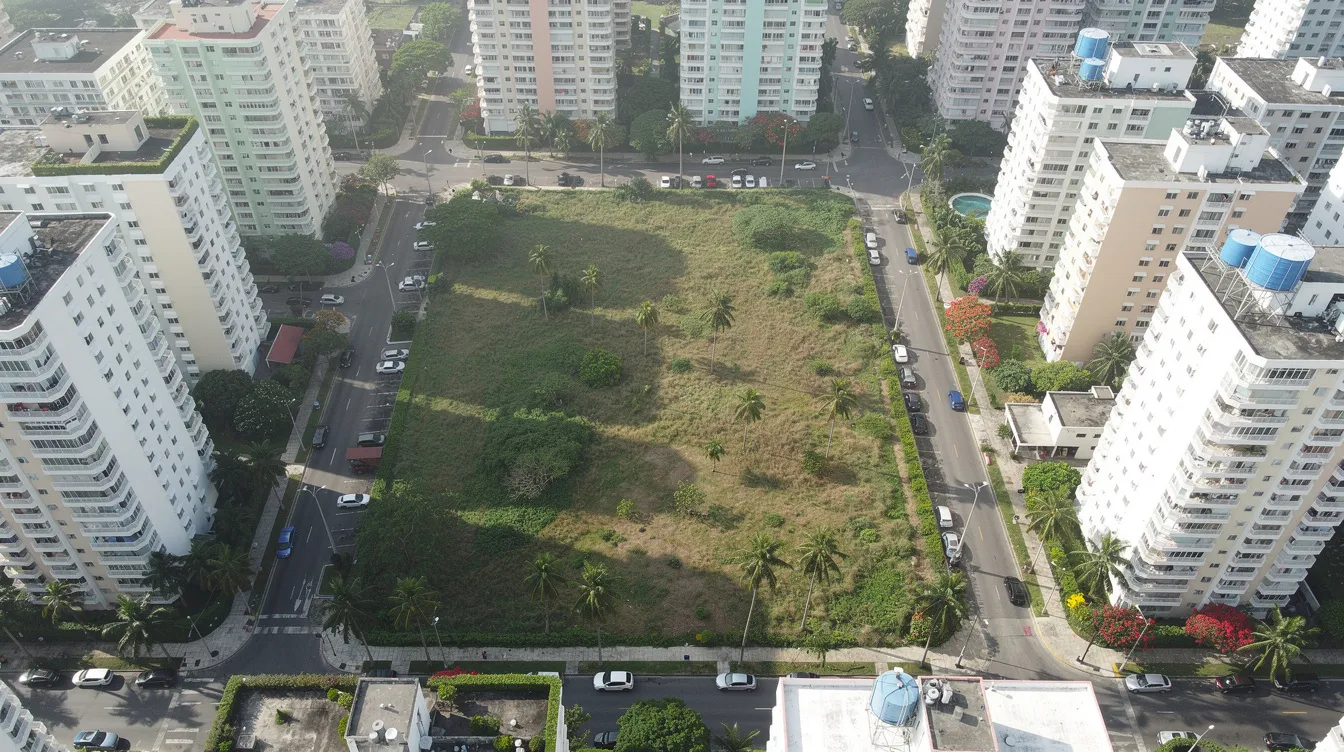
The Singapore government releases land parcels for development through the Urban Redevelopment Authority’s GLS programme. GLS sites are sold by public tender in Singapore: developers submit sealed bids, and the highest bid above the reserve price wins. Once results are published, anyone can see the top bid, the land rate in dollars per square foot per plot ratio, and the number of competing bids. This transparency is what makes GLS land prices such a powerful leading indicator for future launches.
What Exactly Is GLS Land Price (PSF PPR)?
The primary metric for land cost is price per square foot per plot ratio. The formula is simple:
Land PSF PPR = Total Land Price ÷ (Site Area × Plot Ratio)
The plot ratio, set by URA’s Master Plan, determines how much gross floor area a developer can build on the site. A higher plot ratio means more buildable space, which spreads the land cost over more units. For example, if a Tampines GLS site sells for roughly S$543 million on a 27,000 sqm site at a 3.0 plot ratio, URA will report a land rate around S$1,000+ psf ppr.
URA and the media always quote psf ppr because it allows fair comparison between sites with different sizes and densities. Without normalising for plot ratio, a large suburban site and a compact city fringe site would be impossible to compare meaningfully.
For EC GLS sites, psf ppr levels are typically 35–45% lower than pure private sites in the same region. In 2025–2026, EC land rates ranged roughly S$692–794 psf ppr, compared to private residential medians well above S$1,000 psf ppr.
The Difference Between Land PSF PPR And Launch PSF
Buyers see launch prices quoted in dollars per square foot of saleable unit area. That figure already bakes in corridors, lift lobbies, voids, balconies, and every cost item from concrete to commission. The gap between land psf ppr and launch PSF is not profit-it is the entire cost of turning raw land into a liveable home.
Consider a concrete illustration: a land rate of S$1,300 psf ppr in the RCR might reasonably produce launch prices of S$2,600–S$2,900 per square foot after construction, financing, marketing, and margin are layered in. That near-doubling shocks some buyers, but it reflects real economics, not gouging.
Not all gross floor area is saleable. Typical net-saleable efficiency in well-designed projects ranges 70–80%, meaning 20–30% of GFA goes to common corridors, plant rooms, and structural elements. This unsaleable area dilutes land cost per saleable square foot, which helps explain the multiplier between land psf ppr and launch PSF.
This gap is exactly where cost-stack analysis comes in. The next section shows how developers convert a land rate into breakeven and launch prices-and how you can replicate that logic.
Why GLS Land Prices Lead Future Launch Prices
In land-scarce Singapore, Government Land Sales is the cleanest, most transparent signal of future supply and pricing. GLS releases follow the URA Master Plan for future developments, and because bids are public, every market participant-including competing developers-can see the price floor being set in real time.
Land prices set a baseline that influences final condo prices. A high land rate-such as the approximately S$1,455 psf ppr bid at Tanjong Rhu Road in February 2026-essentially locks in a breakeven that makes sub-S$2,000 psf launches impossible without the developer accepting losses. A $1,455 psf ppr land bid implies launch prices around $3,100 psf once full costs and margin are applied.
Developers also look at recent GLS comparables nearby. When two sites in the same micro-market (say, multiple Lentor or Bayshore parcels) are tendered within a year of each other, the later bid rarely undercuts the earlier one by much. Higher land bids lead to increased breakeven prices for developers, creating a ratchet effect on neighbourhood pricing. A competitive bidding process can influence the overall perceived value of a GLS site, sometimes pushing bids beyond what pure residual-value models suggest.
Understanding this price-setting mechanism is the foundation. Now let’s break down exactly how that land psf ppr transforms into the number you will see on a price list.
From GLS Land Price To Breakeven And Launch PSF
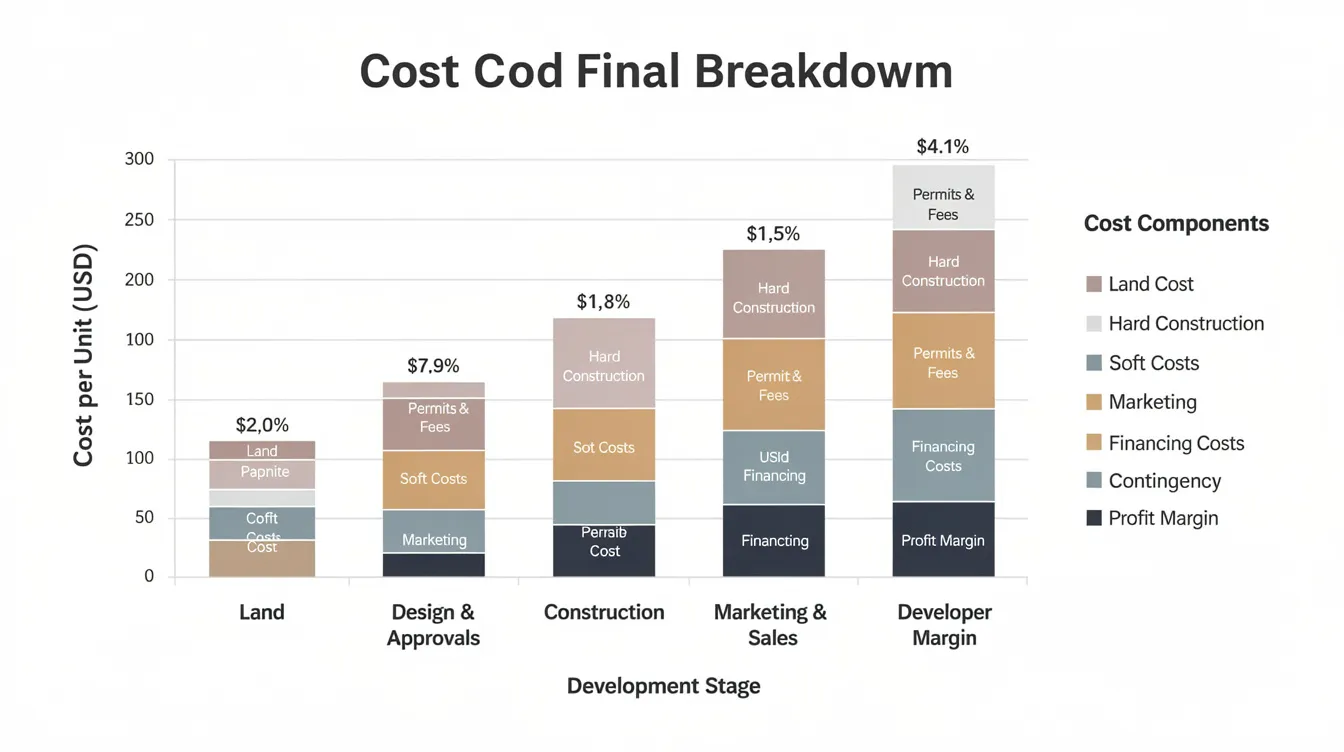
Predicting launch PSF is fundamentally about building a full “cost stack”: land plus construction plus soft costs plus taxes plus the developer’s margin. Total development cost includes land costs, construction, financing, and marketing expenses-and while exact numbers differ by site, the structure and order of cost items are remarkably consistent. This consistency is what allows buyers and analysts to project pricing credibly, even before a single pile is driven.
The examples below use 2025–2026 RLB Singapore construction cost benchmarks, current BSD rules, and typical margins observed in Singapore launches.

Step 1: Start With Awarded Land PSF PPR
Head to the URA GLS tender results page and look for the tender ID, site address, top bid in dollars, land rate psf ppr, winning developer, and bid count. The bid count tells you how competitive the site was-more bidders generally signal stronger developer confidence in the location.
Record the land rate as the first row of a simple spreadsheet. This is the “floor” of your cost stack. Government Land Sales determines future launch prices for residential properties, so this single number anchors everything that follows.
Keep a small watchlist of GLS sites in areas you care about-Bayshore, Tampines, Lentor, Holland Plain, Peck Hay Road-with their psf ppr so you can compare when future launches are announced. Reserve list sites and confirmed list sites behave slightly differently (confirmed list sites are put up for tender on a fixed schedule, while reserve list sites require a developer to express interest), but the pricing logic once awarded is identical.
Step 2: Add Construction Costs Using Real Benchmarks
Hard construction cost is usually the second-largest component after land. Construction costs typically range from $600 to $1,000 per square foot depending on project specifications, height, basement complexity, and site constraints. RLB’s 2H 2025 Singapore report pegs “Good Quality Condominium” projects at roughly SGD 3,690–4,650 per square metre of covered floor area, which translates to approximately SGD 343–432 per square foot-before adding foundations, M&E systems, external works, and preliminaries that can push the total 10–15% higher.
Indicative ranges by segment:
-
OCR mass-market: S$600–S$750 psf of saleable area (simpler finishes, lower-rise)
-
RCR city fringe: S$700–S$900 psf (mid-to-high specification, often mid-rise with basement parking)
-
CCR high-spec: S$850–S$1,000+ psf (premium finishes, taller structures, deeper basements, branded fittings)
Construction costs add $600 to $1,000 per square foot to the development budget. Boutique projects with fewer units-say under 200 homes-tend to carry higher per-unit construction PSF because fixed costs like site mobilisation, show gallery, and infrastructure works are spread over a smaller saleable base.
Step 3: Layer In Professional Fees, Financing, And Marketing
Beyond bricks and steel, several soft-cost categories add meaningfully to breakeven:
-
Professional fees (architect, structural and M&E consultants, project management, quantity surveying): typically 5–7% of total development cost
-
Authority and statutory fees: development charges, plan submission fees, infrastructure contributions
-
Financing interest: interest during the 3–4 year construction period on land acquisition and progress payments; at current rates, this can add S$80–S$150 psf
-
Marketing and sales: showflat construction, advertising, agency commissions, launch events; marketing costs significantly influence the final launch price and can run S$50–S$120 psf depending on scale and aggressiveness
-
Buyer’s stamp duty on land acquisition and GST: a material line that the developer pays upfront
These soft costs are often consolidated into a single “non-land cost” per psf band for simplicity. In a moderate scenario, total soft costs may add S$250–S$400 per square foot of saleable area. Note that rising interest rates or an unusually lavish showflat can easily shift breakeven up by 50–100 psf.
Step 4: Compute Breakeven PSF
Here is the formula in plain language:
Breakeven PSF ≈ (Land psf ppr ÷ efficiency factor) + all-in construction cost psf + soft cost psf
The efficiency factor converts GFA-based land cost to saleable floor area cost. If land psf ppr is S$1,000 and efficiency is 75%, the land cost per saleable square foot is S$1,000 ÷ 0.75 ≈ S$1,333.
Walk-through for a hypothetical 99-year OCR site bought at S$1,000 psf ppr:
|
Component |
Calculation |
PSF (Saleable) |
|---|---|---|
|
Land cost (adjusted for 75% efficiency) |
S$1,000 ÷ 0.75 |
~S$1,333 |
|
Hard construction cost |
Mid-range OCR |
~S$680 |
|
Professional fees (~6% of above) |
6% × S$2,013 |
~S$121 |
|
Financing interest |
3-year build |
~S$110 |
|
Marketing & agency |
Standard launch |
~S$80 |
|
Estimated breakeven |
~S$1,850–S$1,900 |
Breakeven price is calculated from land cost plus construction and fees. This breakeven represents “no loss, no profit” at project level and excludes contingencies for delays, weak sales, or cost overruns. Any fair launch-price estimate must sit meaningfully above breakeven to account for the developer’s risk and required return.
Step 5: Add Developer Margin To Get Indicative Launch PSF
Developers add a 15% to 30% margin on breakeven costs, depending on market conditions and project positioning. Typical ranges:
-
10–15%: cautious market, high competing supply, or a developer willing to accept lower returns for faster capital recycling
-
15–20%: base-case in a balanced market with steady demand
-
18–22%+: strong seller’s market, iconic location, limited future supply, or branded partnerships
The formula is straightforward:
Launch PSF ≈ Breakeven PSF × (1 + margin %)
Using the OCR breakeven of S$1,850 from the previous step:
-
At 15% margin: S$1,850 × 1.15 ≈ S$2,128 psf
-
At 20% margin: S$1,850 × 1.20 ≈ S$2,220 psf
Developers may still price different stacks and bedroom types differently. Higher-floor units and those facing unblocked views typically carry premiums of 3–8% over the average launch PSF, while lower-floor or west-facing stacks may sit at or slightly below the headline figure. Developers may price above breakeven due to market demand and project specifics-particularly when a site offers MRT connectivity or waterfront views that comparable projects lack.
A Worked Example: Predicting Launch PSF From A Real GLS Site
Theory is useful, but a concrete walk-through makes the method actionable. Below is a worked example using a real site with publicly available land tender data, showing how each cost layer builds toward an indicative launch PSF.
Site Snapshot: Location, Land Rate, And Planned Use
Pinery Residences (Tampines Street 94) – an OCR site in District 18, 99-year leasehold tenure. The land was acquired at approximately S$1,004 psf ppr. The site is close to Tampines MRT and several established schools, making it a typical family-buyer OCR project. At this land rate, the project is a useful benchmark because it sits near the median for outside central region GLS sites and has since launched, giving us actual pricing to validate the method.
Land acquisition costs typically range from 38% to 53% of the final launch price across Singapore projects, but for Pinery Residences, land cost made up about 44% of the eventual launch price-right in the middle of that band.
Building The Cost Stack Line By Line
Using 2025 cost benchmarks and publicly available data for an OCR project of this scale:
-
Land cost per psf ppr: S$1,004
-
Adjusted for ~75% GFA-to-saleable efficiency: S$1,004 ÷ 0.75 ≈ S$1,339 psf (saleable)
-
Hard construction cost: ~S$680 psf (mid-spec OCR, mid-rise with standard basement)
-
Professional fees (~6%): ~S$121 psf
-
Financing interest (3-year build): ~S$100 psf
-
Marketing, showflat, agency commissions: ~S$85 psf
-
Contingency: ~S$40 psf
Non-land costs total roughly S$1,026 psf. Adding land gives a breakeven of approximately S$1,930–S$2,000 psf.
Assumptions: 18–20% gross-to-net efficiency loss between GFA and saleable area; standard OCR finishes (not luxury); no unusual soil or site remediation costs.
Deriving An Indicative Launch PSF Range
Applying margin scenarios to the ~S$1,960 psf midpoint breakeven:
|
Scenario |
Margin |
Indicative Launch PSF |
|---|---|---|
|
Conservative |
12% |
~S$2,195 |
|
Base case |
18% |
~S$2,313 |
|
Aggressive |
22% |
~S$2,391 |
The actual launch of Pinery Residences came in at approximately S$2,340 psf-almost exactly in line with the base-case estimate. Land cost accounts for about 70% of selling price when you include the efficiency adjustment and consider that all other costs are layered on top of the land base.
Compared to resale PSFs of nearby projects in Tampines (which at the time ranged roughly S$1,400–S$1,700 psf for older 99-year condos), the new launch premium of roughly 35–50% is within the typical band for OCR family-oriented projects. Newly launched projects can impact surrounding property resale values based on various market dynamics-in this case, nearby resale condos saw modest price appreciation after Pinery’s launch validated higher PSF levels in the sub-market.
Recent 2023–2026 examples consistently show that well-constructed cost-stack estimates land within 5–10% of the actual launch PSF when all inputs are updated and efficiency is modelled carefully.
How To Apply This Method Yourself Before A Launch
The worked example above is not a one-off trick-it is a repeatable process you can apply to any upcoming GLS site. Below is a practical mini-playbook you can follow the moment tenders close and results are published, well before any showflat opens.
Step-By-Step Checklist
-
Identify the GLS site and save its psf ppr. Visit the URA past sale sites page immediately after tender results are released. Record the address, land rate psf ppr, winning bid, bid count, and plot ratio. A GLS tender runs for a few weeks and closes on a set day, so you can calendar key dates.
-
Determine the site’s planning region (OCR, RCR, or CCR) and tenure. This dictates which construction cost band and margin assumption to use. City fringe (RCR) sites carry different economics from OCR suburban plots.
-
Pull construction benchmarks. Use the latest RLB Singapore construction cost report or BCA statistics to anchor your hard-cost estimate. Adjust for project scale-fewer units means higher per-unit costs.
-
Estimate soft costs. Add professional fees (5–7% of development cost), financing interest (based on prevailing rates and a 3–4 year build timeline), and marketing/agency costs. Developers use GLS bids to gauge future pricing pressure, so factor in whether the site’s competitive intensity suggests a more aggressive or modest marketing spend.
-
Calculate breakeven PSF. Divide land psf ppr by your assumed efficiency factor (0.72–0.80), then add all construction and soft costs per saleable square foot.
-
Apply a developer margin range (15–20%). This gives you a launch PSF band rather than a single point estimate-more realistic and more useful for planning.
-
Check against nearby resale PSF and recent new launch comparables. Resale properties provide a critical benchmark for determining the viability of launch pricing. If your estimated launch PSF is more than 20–25% above the best nearby resale transactions, ask what justifies the gap.
-
Stress-test against your personal affordability. Run the numbers through current TDSR/MSR limits and factor in ABSD if applicable. Projected launch PSF combines land cost and nearby resale comparables, but your purchase decision must also pass your own financial stress test.

Quick Comparison Table: GLS Land Rate vs Indicative Launch PSF
Rules-of-thumb can help sanity-check your own numbers. The table below summarises broad guideposts based on 2024–2026 GLS tender data and observed launches:
|
Region |
Typical Land PSF PPR (2024–2026) |
Rough Multiplier to Breakeven |
Indicative Launch PSF (15–20% margin) |
|---|---|---|---|
|
OCR |
S$900–S$1,200 |
~1.8–2.0× |
S$2,000–S$2,500 |
|
RCR |
S$1,300–S$1,500 |
~1.8–2.0× |
S$2,550–S$3,300 |
|
CCR |
S$1,600–S$1,900+ |
~1.9–2.1× |
S$3,500–S$4,500+ |
|
EC |
S$690–S$800 |
~1.7–1.9× |
S$1,350–S$1,650 |
These are broad guideposts. Individual projects may sit above or below depending on integrated facilities, proximity to an MRT station, top school catchments, or branded developer partnerships. The highest recent GLS bid was $1,865 psf ppr, which would mechanically imply a launch PSF north of S$3,500 in the CCR. A $1,388 psf ppr land bid suggests launch prices around $2,700 psf, consistent with what projects like those in the Bayshore cluster have demonstrated.
Interpreting The Numbers For Your Own Decision
An estimated launch PSF is only useful if you connect it to your actual financial position. Here is how:
-
Total quantum check: Multiply estimated launch PSF by the saleable area of your preferred unit type. A 3-bedroom unit of 1,000 sq ft at S$2,300 psf means a S$2.3 million ticket-run that through your loan eligibility under current TDSR rules.
-
Upgraders timing HDB sale: If your estimated launch PSF for a target site suggests a quantum above your combined CPF + cash after selling your HDB, you know early to either wait for a more affordable site or adjust expectations.
-
Investors comparing asset classes: The same GLS-to-launch-PSF logic can inform whether residential property investment at current entry prices offers better value compared to industrial or commercial exposure.
-
Business owners planning staff housing: Properties near new infrastructure developments are perceived as more valuable by buyers, and a new GLS launch nearby can shift rental benchmarks for employee housing.
If you want a deeper, customised breakeven and exit-strategy review for a specific GLS site, Aesthetic Havens provides data-driven analysis across residential, commercial, and industrial assets. Share a target site and budget, and the team can model scenarios tailored to your situation.
Key Variables That Can Shift Launch PSF Away From GLS Land Math
The cost stack gives you a strong baseline, but market and policy realities can push actual launch prices above or below the mechanical estimate. Four major sources of deviation deserve attention: project design and efficiency, market sentiment, policy shifts, and competing supply in the micro-market.
Project Design, Efficiency And Unit Mix
Higher efficiency-more saleable floor area per unit of gross floor area-reduces breakeven per saleable square foot. Conversely, lavish sky terraces, wide corridors, and oversized balconies eat into saleable area and raise effective cost per square foot even though they enhance the lifestyle proposition.
A skew toward larger units (3-bedroom and above) may allow higher nominal PSF because buyers often focus on total quantum rather than per-square-foot cost, and lifestyle positioning justifies a premium. Mixed-use or integrated projects with retail and transport links introduce extra construction cost but also justify pricing above bare GLS math. Site-specific factors can increase launch prices beyond estimates, particularly when a development includes direct MRT access or a signature architectural design.
Market Sentiment And Sales Strategy
Developers may launch slightly below the “theoretical” price in a soft market to create momentum-selling 60–70% of units on launch weekend, then using that sell-through as justification to raise prices in subsequent phases. Market conditions at launch can affect pricing even if land costs are high.
Conversely, in years when OCR or RCR future supply is thin, a developer might launch at a thinner perceived margin if they expect fast sell-through and quick capital recycling. The pace of first-month sales often determines whether prices are held, cut selectively through rebates, or raised across stacks. Waiting for sentiment to shift can work in your favour or against you.
Policy, Financing And Cost Inflation
Changes in ABSD, LTV ratios, or TDSR rules can abruptly affect demand, forcing developers to shade launch PSF down or offer creative incentives like furniture packages and stamp-duty absorption. Developers add 20% to land cost for construction and profit as a rough starting assumption, but policy headwinds can compress that margin quickly.
Construction-cost inflation hits projects awarded in one year but launching two or three years later. Labour shortages, materials price spikes, or supply-chain disruptions can raise breakeven significantly-sometimes by 5–10%-after the land bid is already locked in. Market conditions can push prices above the basic cost formula when cost inflation coincides with strong demand.
Neighbouring Supply And Resale Benchmarks
Competing supply from other GLS sites in the same micro-market creates an implicit ceiling and floor for launch PSF. When the government releases two sites in quick succession-as happened with multiple Lentor plots-developers must price carefully to avoid cannibalising each other’s sales. Developers use strategic bidding to raise future land prices, but the market’s absorption capacity for any one sub-market is finite.
A large gap between estimated launch PSF and nearby resale prices must be justified by tangible advantages: newer facilities, remaining lease, MRT proximity, or brand premium. Buyers comparing new launch pricing against URA caveats data for nearby 5-year-old resale projects will quickly spot whether a projected price represents fair value or an aggressive stretch.
Common Mistakes When Using GLS Land Prices To Predict Launch PSF
Many buyers glance at a headline psf ppr, apply a rough mental multiplier, and jump to conclusions that lead to poorly timed decisions. Here are four typical errors and how to avoid them.
Relying On Land Price Alone Without Cost Stack
Just multiplying land psf ppr by an arbitrary factor-say “×1.8”-can be misleading, especially across different regions and project types. A CCR luxury site and an OCR mass-market site may share similar multiplier ranges but wildly different absolute cost structures. Construction costs typically range from $600 to $1,000 per square foot depending on specifications, and ignoring this variability can throw your estimate off by hundreds of dollars per square foot.
The corrective is simple: always add separate lines for construction and soft costs, even if you are using rough percentages. A five-row spreadsheet beats a single multiplication every time.
Ignoring Plot Ratio, GFA Efficiency And Site Constraints
Comparing a low-plot-ratio boutique site directly to a high-density mass-market site without adjusting for efficiency is a common trap. A site with a 1.4 plot ratio producing 150 units has fundamentally different economics from a 3.5-plot-ratio site yielding 800 units. Major retaining walls, contaminated soil, or deep basement requirements can add S$100–200 psf to construction cost that a surface-level analysis misses entirely.
Scan the URA Master Plan and tender documents for clues: height controls, road-widening reserves, noise buffers from expressways, or drainage obligations all affect cost and, by extension, launch PSF.
Not Accounting For Time Lag And Cost Inflation
A 2022 GLS land rate cannot be translated into a 2026 launch PSF using 2022 construction costs. Between 2021 and 2026, median GLS land psf ppr rose from approximately S$1,204 to S$1,526-and construction costs climbed in parallel. Developers that won land in 2023 at seemingly “low” rates may still face elevated breakevens by the time they launch in 2026 due to accumulated inflation.
Update your assumptions yearly using the latest RLB, BCA, or industry cost guides and cross-reference with recent launch case studies to keep your model current.
Misreading Developer Margins (Too High Or Too Low)
Retail headlines about “record land bid” amounts can cause buyers to assume huge profit margins, when in reality 2026 developer margins are expected in the 8–15% range for many projects-squeezed by rising costs across the board. Conversely, do not assume developers will accept razor-thin margins indefinitely. Unsold units in a premium location can be held and released later when pricing power returns.
Treat margin as a range-not a fixed 20%-and cross-check with observed pricing behaviour in other launches by the same developer. If a developer consistently launches at tight margins and sells quickly, that pattern is likely to repeat.
Conclusion And Next Steps
GLS land prices set the starting point, the cost stack and market conditions translate that starting point into launch PSF, and informed buyers can approximate this months before showflats open. The method is not guesswork-it is grounded in public data, industry-standard cost benchmarks, and observable developer behaviour.
The practical flow in one sentence: land psf ppr → add realistic hard + soft costs → compute breakeven → apply margin → compare to resale and your budget.
Here are your concrete next steps:
-
Pick 1–2 GLS sites you care about and pull their tender results from URA, noting psf ppr, bid count, and developer.
-
Build a simple spreadsheet using the five-step method outlined above-land, construction, soft costs, breakeven, margin.
-
Benchmark against nearby resale condos and recent launches using URA Realis caveat data or property portals.
-
Stress-test affordability under current TDSR, MSR, and ABSD rules before committing emotionally to any price point.
-
Contact Aesthetic Havens for a customised breakeven and strategy session, especially if you are weighing residential property investment alongside industrial or commercial assets.
Related topics worth exploring next include understanding URA Master Plan changes and their impact on future supply, reading industrial land tenders using the same cost-stack logic, and evaluating rental yields versus entry PSF to determine whether a new launch purchase or a resale unit offers better value for your goals.
Additional Resources And FAQs
This section offers quick-reference answers and tools to help you apply the framework consistently across different GLS sites and market conditions.
Useful Public Data Sources
-
URA GLS portal: Tender documents, award results, and land rate psf ppr for every government land sales site
-
URA Realis / caveats: Transaction-level data for resale and new-sale PSF across all districts
-
RLB Singapore construction cost reports: Biannual benchmarks for residential, commercial, and industrial construction costs
-
MAS and bank websites: Current mortgage rates, TDSR guidelines, and ABSD schedules
-
Aesthetic Havens market articles: Analysis of GLS trends, industrial land, and residential project comparisons
Bookmark these sites and revisit them whenever a new GLS tender closes in your target area. Data freshness matters-construction cost inflation can shift breakeven meaningfully between report cycles.
Frequently Asked Questions
How soon after a GLS tender can I reasonably estimate launch PSF? You can build a credible estimate within days of the tender result being published. The land psf ppr is the hardest variable to predict before the tender-once it is known, the remaining cost-stack inputs are relatively stable and publicly benchmarked.
Is there a simple multiplier from land psf ppr to launch PSF I can use as a first cut? As a rough starting point, multiply land psf ppr by 2.0–2.3× for OCR and RCR sites, and by 2.1–2.5× for CCR sites. But this shortcut is no substitute for a line-by-line cost stack, particularly when site constraints or unusual specifications are involved.
Why do some launches price far above what GLS land math suggests? Developers may price above breakeven due to market demand, branding partnerships, integrated mixed-use elements, or exceptional location attributes like waterfront views or direct MRT access. When demand is strong and competing supply is thin, the developer’s margin can expand well beyond the standard 15–20%.
How does this method change for Executive Condominiums? EC sites command lower land psf ppr (roughly S$690–S$800 in 2025–2026), and EC buyers face income-ceiling eligibility and resale restrictions. These factors compress achievable margins. Use the same cost-stack approach but apply a tighter margin range of 10–15% and compare against recent EC launches rather than private condo benchmarks.
Can I apply the same GLS land-to-PSF logic to industrial and business-park sites? The framework is similar-land psf ppr plus construction plus soft costs plus margin-but construction cost benchmarks, plot ratios, and allowable uses differ substantially. Aesthetic Havens regularly advises on industrial and commercial land using adapted versions of this model.
What happens if construction costs spike after the land is bought? The developer absorbs the cost increase, which compresses their margin or forces a higher launch PSF than originally planned. This is a real risk: projects awarded in 2023–2024 that launch in 2026–2027 may face 8–12% higher construction costs than initially budgeted.
Should I wait for GLS launches or buy a nearby resale unit now? There is no universal answer. If your cost-stack analysis suggests a future launch PSF significantly above current resale prices, and you are comfortable with the age and remaining lease of a resale property, the resale may represent better value. If you prefer new facilities, longer lease, and are willing to pay the premium, waiting for the launch makes sense-but confirm your budget can handle the projected quantum.
Aesthetic Havens can help translate these frameworks into tailored, project-specific advice-whether you are evaluating a single GLS site for your family home or comparing residential, commercial, and industrial assets as part of a broader property investment strategy.

