

Introduction
A city-fringe new launch bought at launch price in 2014 and held for a full decade is one of the most instructive case studies a Singapore property investor can examine. This article breaks down the entry price per square foot, rental income collected, holding costs absorbed, and exit price realised on a representative 750 sq ft two-bedroom condo in the Rest of Central Region (RCR), using data anchored to actual market conditions from 2014 through 2024.
The scope is deliberately narrow: one private condo unit (not an Executive Condominium), purchased at developers sales in a city-fringe district such as District 8 or 12, financed with a standard 75% bank loan, and sold on the resale market after 10 years. We exclude en bloc windfalls, exotic financing structures, and commercial property. The audience is Singapore-based investors, upgraders, and developers who want to understand the true decade-long performance of new launches in city-fringe locations versus their expectations – and versus alternative uses of capital.
In our base case, a 750 sq ft city-fringe condo bought at S$1,700 psf (S$1.275 million) in 2014 and sold at approximately S$2,050 psf in 2024 delivers a net annualised return of roughly 5–7% per annum on equity invested, after mortgage interest, taxes, maintenance, and realistic vacancy assumptions – a figure that deserves careful unpacking.
Here is what you will take away from this case study:
-
The typical entry price per square foot for city-fringe new launches around 2014 and how it compares to 2024 resale transactions and new projects.
-
Total rental income collected over 10 years and how vacancy, agent fees, and operating costs reduce gross rent to net cash flow.
-
True holding costs: interest paid, buyer’s stamp duty, property tax, MCST fees, repairs, and occasional renovation.
-
The exit price scenario after a full decade and the compounded annual growth rate (CAGR) achieved on investor equity.
-
How this investment property stacks up against leaving the same capital in a diversified equity index or Singapore Savings Bonds.
Understanding a 10-Year City-Fringe New Launch Investment
In Singapore’s planning framework, the “city fringe” refers broadly to the Rest of Central Region – districts like Kallang/Whampoa, Geylang, Queenstown, and Toa Payoh – that sit between the prime Core Central Region and the suburban Outside Central Region (OCR). A “new launch bought at launch price” means a unit purchased directly from developers at the initial sales phase, before any resale premium is layered on.
A 10-year holding period matters because it covers at least one full interest-rate cycle, multiple rental cycles, and enough time for surrounding infrastructure – new MRT stations, government land sales, and urban master plans – to mature. It also clears the Seller’s Stamp Duty window entirely, allowing the investor to sell free of SSD penalties.
Key Investment Variables in a 10-Year Condo Hold
Every property investment over a decade hinges on a handful of financial variables:
-
Entry price per square foot and total quantum at launch. This determines your capital outlay and the baseline against which capital appreciation is measured. City fringe properties often feature lower entry purchase prices per square foot compared to CCR equivalents, compressing the cash required upfront.
-
Loan-to-value ratio and interest rate path. A 75% LTV loan means the investor puts down 25% equity; the interest rate over the decade – which ranged from roughly 1.3% to over 4% as SORA replaced SIBOR – dictates the cost of leverage. Financing costs and interest rates significantly affect net rental yields over a long holding period.
-
Rental rate, vacancy assumptions, and rental escalation. Monthly rent drives cash inflow; vacancy of even one month per lease cycle and agent commissions of half to one month’s rent per tenancy can reduce gross rent by 5–10% annually.
-
Operating costs. MCST fees, property tax at non-owner-occupied rates, insurance, upkeep, and one-off renovation cycles are recurring drains. Carrying costs such as taxes and maintenance can impact the total return of property investments.
-
Exit psf and transaction costs. The resale price at year 10 crystallises capital gains; agent commission, legal fees, and any last-minute touch-ups eat into proceeds.
Higher entry psf compresses yield; higher rents cushion interest rate spikes. The interplay of these factors determines whether a city-fringe condo delivers better returns than a passive portfolio – or falls short.
Why City-Fringe New Launches Behave Differently from Core Central and OCR
City-fringe developments sit in a distinctive segment of the property market. They are nearer to the central business district than OCR projects, often served by MRT access and mixed-use elements, yet priced below the substantial premium commanded by CCR luxury units.
The three regions behave differently over decades:
-
Core Central Region (CCR): Luxury focus, more volatile pricing, heavier foreign buyer influence, and susceptibility to cooling measures targeting high-end purchases.
-
Rest of Central Region (RCR / city fringe): Strong rental demand from PMETs and professionals, limited new supply near the CBD, and rising demand driven by urbanisation and government land sales promoting growth. Tenants are more likely to lease properties within 500 meters of major transport nodes – a feature many RCR projects offer. City fringe locations typically offer higher gross rental yields than prime downtown areas.
-
Outside Central Region (OCR): More mass-market, more sensitive to ABSD and TDSR cooling measures, and dependent on suburban amenity build-out for value growth.
Because RCR behaves differently – with a blend of rental yield strength and steady capital appreciation – this case study focuses on a representative city-fringe project launched around 2014, mirroring actual market data while keeping the example anonymous.
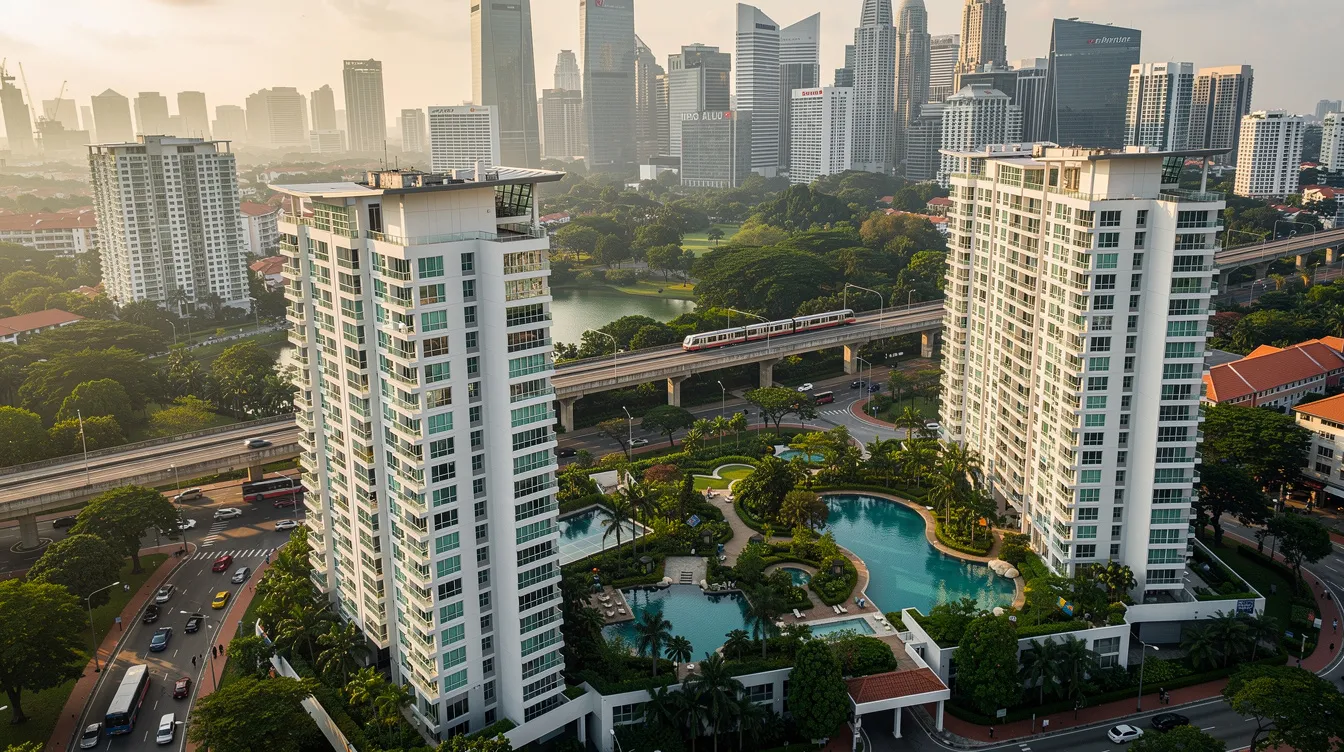
Case Study Setup: A Specific City-Fringe Condo Bought at Launch
Our subject is a 750 sq ft two-bedroom unit in a city-fringe new launch near Boon Keng MRT in District 12, launched in mid-2014 with Temporary Occupation Permit (TOP) obtained in 2018. All numbers are rounded but anchored to realistic 2014–2024 Singapore market conditions – cooling measures, interest rates, rents, and the ABSD regime of the period. No en bloc scenario is assumed.
Profile of the Development and Unit
The development is a mid-sized project of approximately 500 units on a 99-year leasehold site, located 10–15 minutes’ drive from the CBD. Key amenities include a pool, gym, retail at the ground floor, and direct proximity to the Boon Keng MRT station – a factor that matters because properties near MRT stations tend to attract higher rental demand and better resale prices.
The specific unit:
-
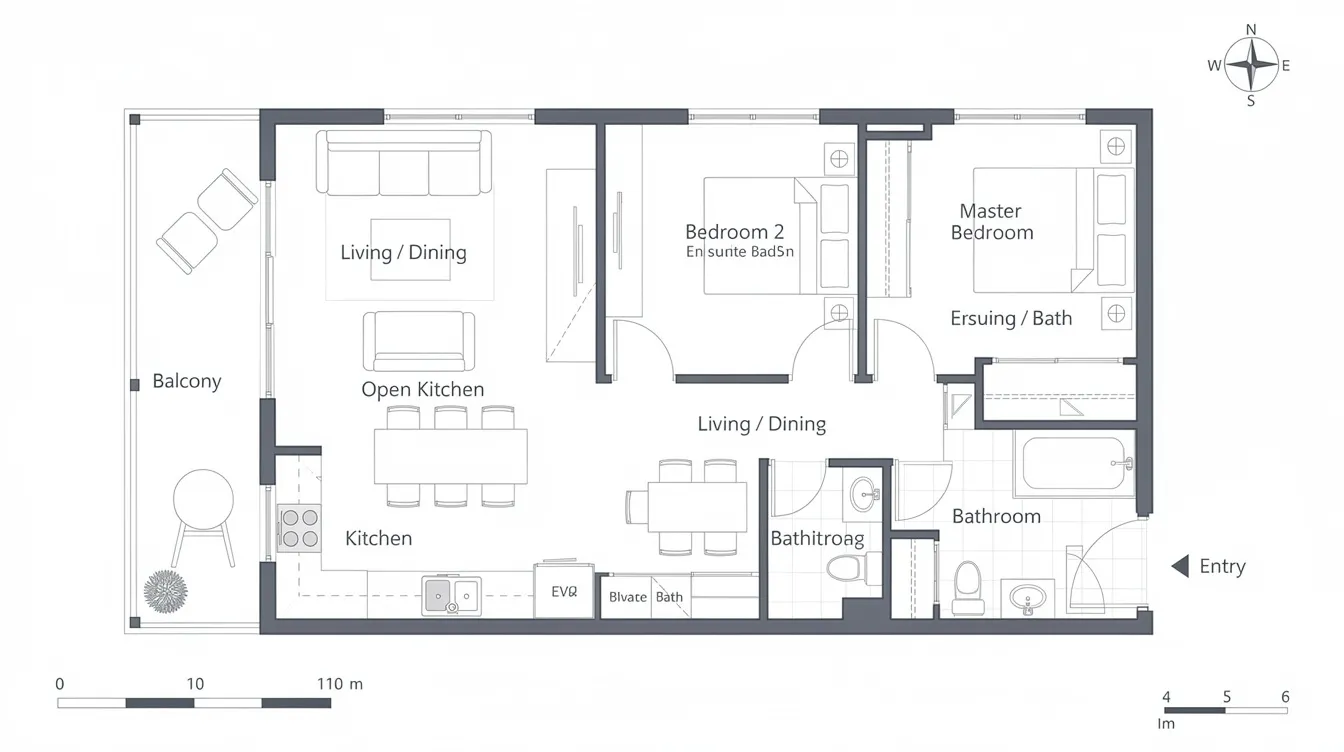
Size: 750 sq ft, two-bedroom, two-bathroom layout with an efficient floor plan. A property’s layout and functional design can influence its value retention over time.
-
Position: Mid-floor, pool-facing, a configuration favoured by tenants seeking natural light and a sense of openness.
-
Launch price: Approximately S$1,700 per square foot, yielding a total quantum of S$1,275,000. This sits within the range of actual 2014 city-fringe launches – the median RCR new-launch psf hovered around S$1,291 in early 2014 per data tracked by analysts, with quality projects in desirable micro-locations commanding S$1,600–S$1,800 psf.
Investor Profile and Financing Structure
Our investors are a Singapore citizen couple in their early 30s. They own an HDB flat as their primary residence and are purchasing this condo as their first investment property – making it their second residential property overall, subject to Additional Buyer’s Stamp Duty.
Financing assumptions:
-
Downpayment: 25% of S$1,275,000 = S$318,750. Of this, 5% in cash (S$63,750) and 20% via CPF (S$255,000).
-
Bank loan: 75% LTV = S$956,250, on a 30-year tenure.
-
Interest rate path: Average approximately 2.3% across the decade, with initial years at 1.3–1.8% (when SIBOR and SOR were near historic lows, per Global Property Guide mortgage data), rising to 3.0–4.0% in 2022–2024 as SORA-based rates climbed.
-
Buyer’s Stamp Duty (BSD): Computed on the tiered 2014 schedule; approximately S$31,350 on a S$1.275 million purchase.
-
ABSD: At 7% for a Singapore citizen buying a second property in 2014 (per IRAS guidelines), this adds S$89,250 in upfront cost – a sum that significantly reduces investible capital and must be earned back through appreciation and rent.
These assumptions feed directly into the return calculations that follow.
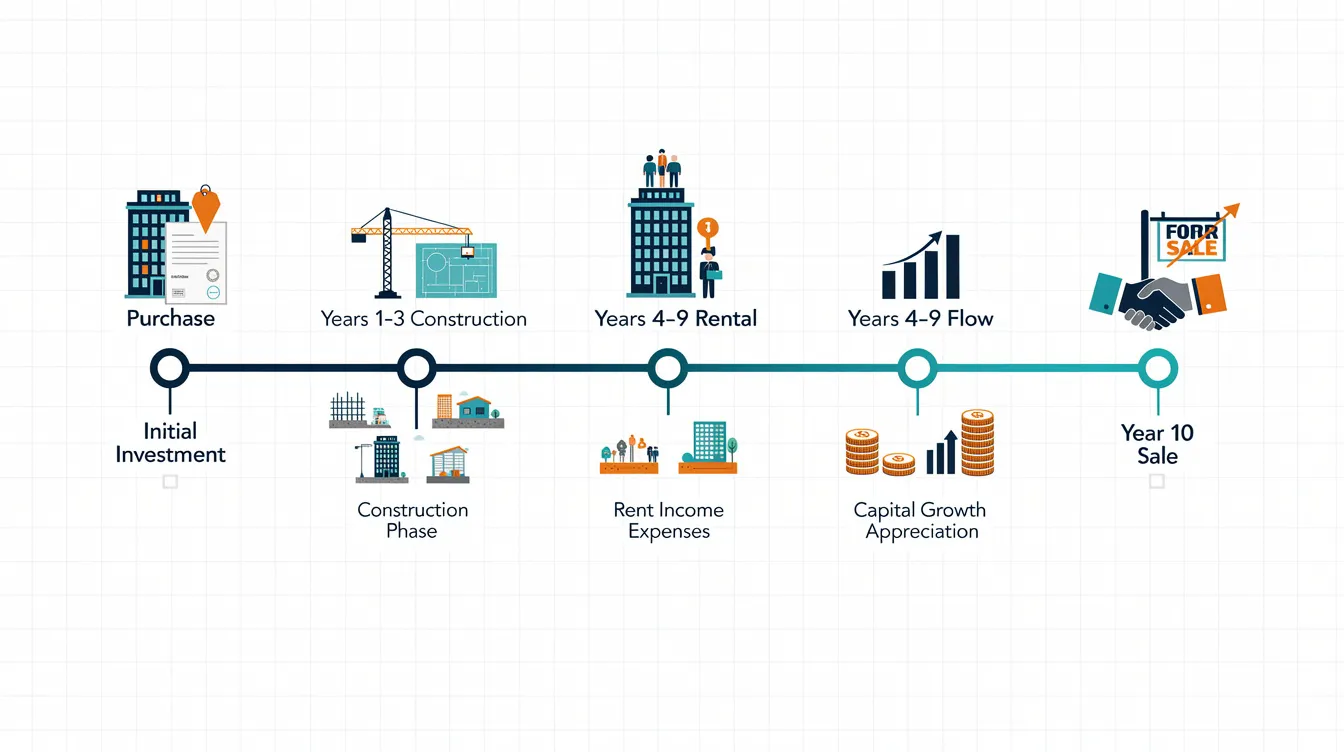
Timeline of the 10-Year Investment
|
Year |
Milestone |
Key Cash Flow |
|---|---|---|
|
2014 |
Option exercised; progressive payment begins |
5% booking + BSD + ABSD |
|
2015–2017 |
Construction milestones; progressive payments |
Loan disbursements, interest on drawn amounts |
|
2018 |
TOP obtained; renovation; unit tenanted |
Renovation spend; first rental income |
|
2018–2024 |
Stable rental period with renewals |
Monthly rent in, mortgage + costs out |
|
2024 |
Unit sold on resale market |
Sale proceeds less outstanding loan and exit costs |
The 10-year horizon is measured from the option exercise date in 2014 to sale completion in 2024.
Entry Price, Upfront Costs, and Progressive Payments
With the setup established, let us quantify the entry psf, taxes, and early cash flows during the construction period – the phase where money flows out with zero rental income to offset it.
Launch Price per Square Foot and Total Quantum
The assumed launch price of S$1,700 psf for 750 sq ft produces a total quantum of S$1,275,000. This is consistent with actual 2014 city-fringe launches in corridors like Commonwealth, Boon Keng, and Potong Pasir, where median new-launch psf for RCR projects ranged from around S$1,291 to above S$1,800 depending on development quality and micro-location.
Early-bird phases and developer discount incentives could shave S$20–S$50 off the effective psf, while higher-floor units or corner stacks might carry a premium of S$30–S$80 psf. These variations matter: a S$50 psf difference on 750 sq ft translates to S$37,500 in upfront cost – and an equivalent shift in eventual profit at exit.
For context, new homes sold for 41 to 50% more than resale units recently, underscoring the substantial premium buyers now pay at new launches compared to the resale market. In 2014, that gap was narrower, giving our investor a more favourable entry point relative to current pricing.
Stamp Duties, Legal Fees, and Renovation Budget
Beyond the purchase price, the upfront non-purchase costs form a significant component of total capital deployed:
-
Buyer’s Stamp Duty (BSD): Approximately S$31,350 on a S$1.275 million purchase (tiered 2014 rates: 1% on first S$180k, 2% on next S$180k, 3% on remainder).
-
Additional Buyer’s Stamp Duty (ABSD): 7% × S$1,275,000 = S$89,250 – the single largest sunk cost beyond the property price itself.
-
Legal and conveyancing fees: Approximately S$3,500–S$5,000.
-
Renovation and furnishing at TOP (2018): Budgeted at S$50,000, geared to rental market expectations – built-in wardrobes, split-unit aircon, a furnished kitchen, and durable flooring. Building quality and amenities play a significant role in property value competitiveness over a decade, so spending wisely here is not optional.
Many investors underestimate these sunk costs when calculating ROI. In total, stamp duties alone amount to over S$120,000 – money that must be recovered through capital appreciation and net rental before any real profit materialises.
Progressive Payment and Interest During Construction
Under a progressive payment schedule typical for a 2014 new launch, the buyer pays in stages tied to construction milestones:
-
5% booking fee at option exercise.
-
15% upon signing the Sale & Purchase Agreement and foundation completion.
-
Subsequent tranches (10% at reinforced concrete framework, 5% at brick/partition wall, 5% at roofing, 5% at electrical wiring, 25% at TOP) progressively disbursed over 3–4 years.
Interest is charged only on the disbursed portion of the loan. During the 2014–2018 construction period, with rates averaging around 1.3–1.8%, estimated total interest paid on progressive disbursements amounts to roughly S$35,000–S$45,000 – a cost with no offsetting rental income.
Total cash outlay up to TOP (approximate):
-
Downpayment (cash + CPF): S$318,750
-
BSD: S$31,350
-
ABSD: S$89,250
-
Legal fees: S$4,000
-
Renovation: S$50,000
-
Interest during construction: S$40,000
-
Total: ~S$533,350
This is the capital at risk before a single dollar of rent arrives.
Rental Income Performance Over 10 Years
Once TOP is achieved in 2018, the property begins to generate rental income – the cash inflow that partially offsets loan servicing, property tax, and maintenance. Gross rental yields for city-fringe properties often range between 5.5% to 6% at favourable entry points, though effective yields after costs are invariably lower.
Initial Rental Rate and Yield at TOP
Based on 2018 city-fringe market conditions, a furnished two-bedroom unit close to an MRT station in District 12 commands approximately S$3,200 per month.
-
Gross annual rent: S$3,200 × 12 = S$38,400
-
Gross rental yield at purchase price: S$38,400 ÷ S$1,275,000 = 3.01%
The yield on purchase price appears modest because the entry price reflects new-launch pricing rather than resale value. However, the rental yield measured against prevailing market value at TOP (which had already appreciated) would be slightly higher.
The marketing period before the first tenant signs typically consumes one month of vacancy. Agent commission of half a month’s rent reduces the effective first-year net rent to approximately S$35,600.
Rental Growth, Vacancies, and Tenant Turnover
Over the seven-year rental period (2018–2024), the rent trajectory follows a recognisable pattern:
-
2018–2019: Modest 1–2% annual growth; rent rises from S$3,200 to approximately S$3,300/month.
-
2020–2021: Flat or slight dip during COVID-related disruptions; rent stabilises around S$3,250–S$3,300/month as the economy softened and some tenants negotiated discounts.
-
2022–2023: Post-COVID rental surge with rising demand from returning expats and limited new supply; rent climbs to S$3,600–S$3,800/month.
-
2024: Stabilisation around S$3,750/month as the market absorbs new homes and more options for tenants become available.
Vacancy assumption: one month of vacancy every two-year lease cycle (for handover, minor touch-ups, and marketing to new tenants). Over seven years, this equates to approximately 3.5 months of lost rent.
Total gross rental income collected (2018–2024): Approximately S$290,000–S$300,000, after factoring vacancy but before operating costs.
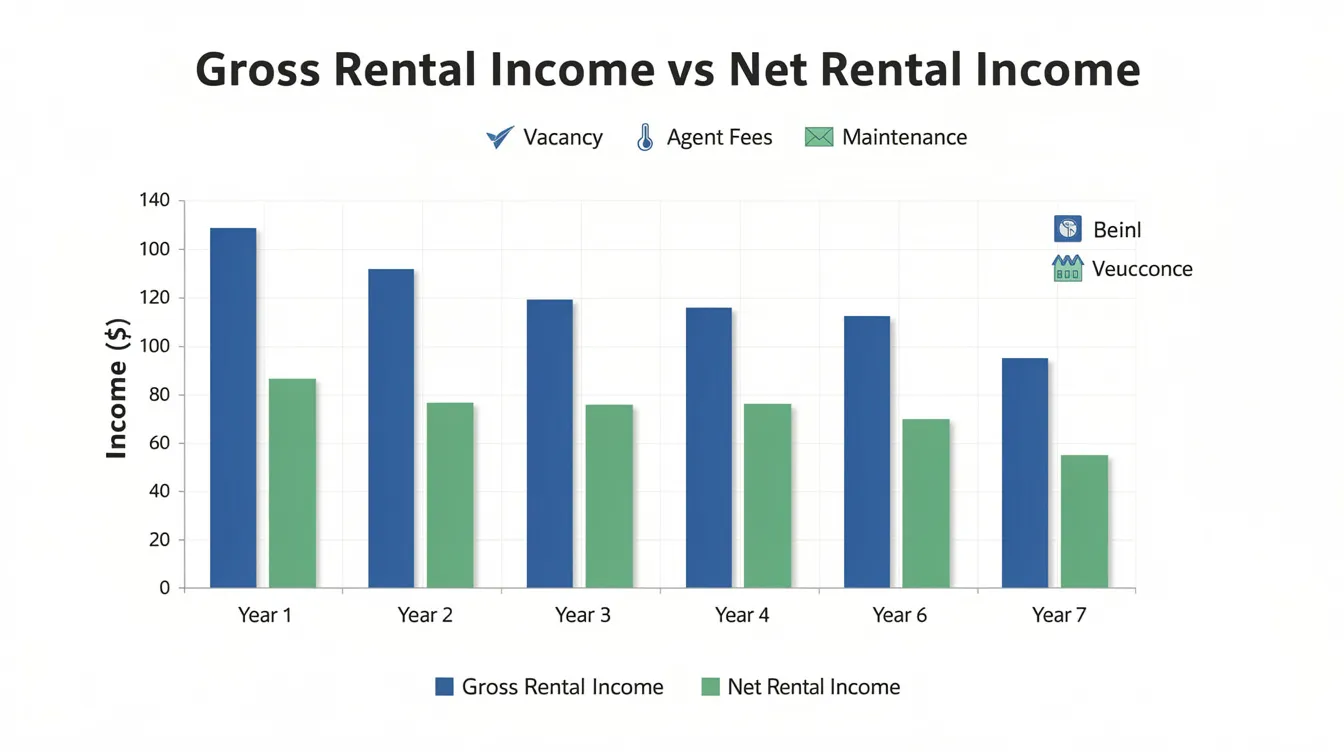
Net Rental Cash Flow After Operating Costs
Annual costs deducted from gross rent include:
-
MCST / maintenance fees: S$350/month average = S$4,200/year.
-
Property tax (non-owner-occupied): Based on IRAS non-owner-occupied rates, and assuming Annual Value around S$36,000–S$42,000 over the period, annual property tax ranges from S$3,600 in early years (when flat 10% of AV applied) to S$5,000+ in later years under progressive rates.
-
Landlord insurance: Approximately S$300–S$400/year.
-
Ad-hoc repairs and aircon servicing: S$800–S$1,200/year on average.
-
Agent commissions: Half-month to one-month rent every two years, averaging S$1,800/year across the period.
The gross-to-net conversion reduces annual rental income by roughly S$10,000–S$12,000 per year.
Seven-year net rental total: Approximately S$215,000–S$230,000.
Holding Costs: Mortgage, Interest, and Ongoing Expenses
Mortgage servicing and hidden expenses can erode the apparent returns from rental income and capital appreciation. This section quantifies what the investor actually pays out over the full decade.
Mortgage Servicing Over 10 Years
-
Initial loan amount: 75% × S$1,275,000 = S$956,250.
-
Tenure: 30 years, variable rate.
-
Monthly instalment range: Approximately S$3,500/month in the low-rate early years (2018–2021), rising to S$4,200–S$4,500/month during the higher-rate period (2022–2024) as SORA climbed above 3.5%.
-
Total mortgage payments over 10 years: Approximately S$460,000–S$480,000.
-
Interest versus principal split: In the early years of a 30-year amortisation, roughly 55–65% of each payment goes to interest. Over 10 years, estimated total interest paid is approximately S$200,000–S$220,000, while principal repaid totals approximately S$260,000.
-
Outstanding loan at year 10: Approximately S$695,000–S$700,000.
The principal reduction effectively builds equity – money the investor recovers at sale – but the interest component is a pure cost.
Other Recurring and One-Off Costs
Beyond mortgage and rental operating costs, additional expenditures over the decade include:
-
Cyclical renovation: Repainting and minor touch-ups every 3–4 years (approximately S$5,000–S$8,000 per cycle), replacement of worn flooring or kitchen fixtures once during the holding period (S$10,000–S$15,000).
-
Major repair: Aircon system overhaul around year 7–8 (S$3,000–S$5,000).
-
Fire insurance and contents coverage: Included in mortgage package or approximately S$200/year if separate.
Ballpark total of these miscellaneous costs over the 10-year period: S$25,000–S$35,000.
Such costs are often omitted in simplistic ROI calculators, yet they represent real money the investor must spend to maintain the property’s competitiveness in the rental and resale market. Increased competition from new nearby developments can suppress rental growth and resale values if the unit is not well-maintained.
Net Cash Position Before Sale
Combining all outflows and inflows before the sale:
Total cash and CPF outflows over 10 years:
-
Downpayment (cash + CPF): S$318,750
-
BSD + ABSD: S$120,600
-
Legal fees: S$4,000
-
Renovation (initial + cyclical): S$80,000
-
Interest during construction: S$40,000
-
Mortgage payments (principal + interest, post-TOP, 7 years): ~S$340,000
-
Miscellaneous costs: ~S$30,000
-
Total outflows: ~S$933,350
Total net rental inflows (7 years, after all costs): ~S$220,000
Net cash injected by investor over 10 years: ~S$713,350
Equity in property at year 10 (before sale): Market value (~S$1,537,500 at S$2,050 psf) minus outstanding loan (~S$697,000) = approximately S$840,000 in equity.
The next section converts this equity into realised return.
Exit Price After 10 Years and Overall Returns
This is the point where the city-fringe new launch’s capital appreciation is crystallised – the moment that determines whether a decade of patience, mortgage servicing, and tenant management was worth the effort.
Realistic Exit Price per Square Foot in 2024
Urban Redevelopment Authority caveat data shows that comparable RCR resale transactions for projects with TOP circa 2017–2019 were transacting at approximately S$2,000–S$2,200 psf in 2024. RCR resale prices hit record highs approaching S$2,384 psf in mid-2025 for the best-performing developments. Meanwhile, new city-fringe launches were hitting approximately S$2,670 psf by late 2024, confirming robust capital appreciation in the segment.
For our base case, we assume a resale price of S$2,050 psf for the 750 sq ft unit → S$1,537,500 exit price.
|
Scenario |
Exit PSF |
Exit Price |
Capital Gain |
|---|---|---|---|
|
Conservative |
S$1,950 |
S$1,462,500 |
S$187,500 (14.7%) |
|
Base Case |
S$2,050 |
S$1,537,500 |
S$262,500 (20.6%) |
|
Optimistic |
S$2,150 |
S$1,612,500 |
S$337,500 (26.5%) |
Macro-economic factors influence the capital appreciation of city-fringe properties – interest rate direction, employment growth, and government cooling measures all play a role in where exit psf lands within this range.
Transaction Costs on Exit
Exit-related deductions include:
-
Agent commission: 2% of sale price = S$30,750 (base case).
-
Legal fees for sale and discharge of mortgage: Approximately S$3,000–S$4,000.
-
Minor touch-up costs (painting, staging) prior to marketing: S$3,000–S$5,000.
-
Seller’s Stamp Duty: Not payable. For properties purchased between January 2011 and March 2017, SSD applies only if sold within four years. After a 10-year hold, our investor is entirely free of SSD – though an early exit in, say, year 2 would have triggered a punishing 12% SSD.
Total exit costs: Approximately S$37,000.
Calculating Net Profit and Annualised Return (CAGR)
Base case calculation:
-
Net sale proceeds: S$1,537,500 – S$697,000 (loan) – S$37,000 (exit costs) = S$803,500
-
Total net profit: S$803,500 (exit equity) + S$220,000 (net rental surplus) – S$533,350 (total equity/cash injected pre-TOP) – S$180,000 (net post-TOP cash injections after rents offset mortgage) = approximately S$310,000
-
CPF principal repaid (recovered at sale): approximately S$255,000 plus accrued interest returned to CPF account.
Annualised return on equity invested (CAGR):
|
Metric |
Base Case |
|---|---|
|
Capital gain |
S$262,500 (20.6%) |
|
Net rental surplus over 10 years |
~S$220,000 |
|
Total net return on investor equity |
~S$310,000 |
|
Annualised return (CAGR on cash + CPF deployed) |
~5.5–6.5% p.a. |
This figure accounts for all costs – stamp duties, interest, property tax, maintenance, vacancy, and transaction fees. It is a realistic, not aspirational, number.
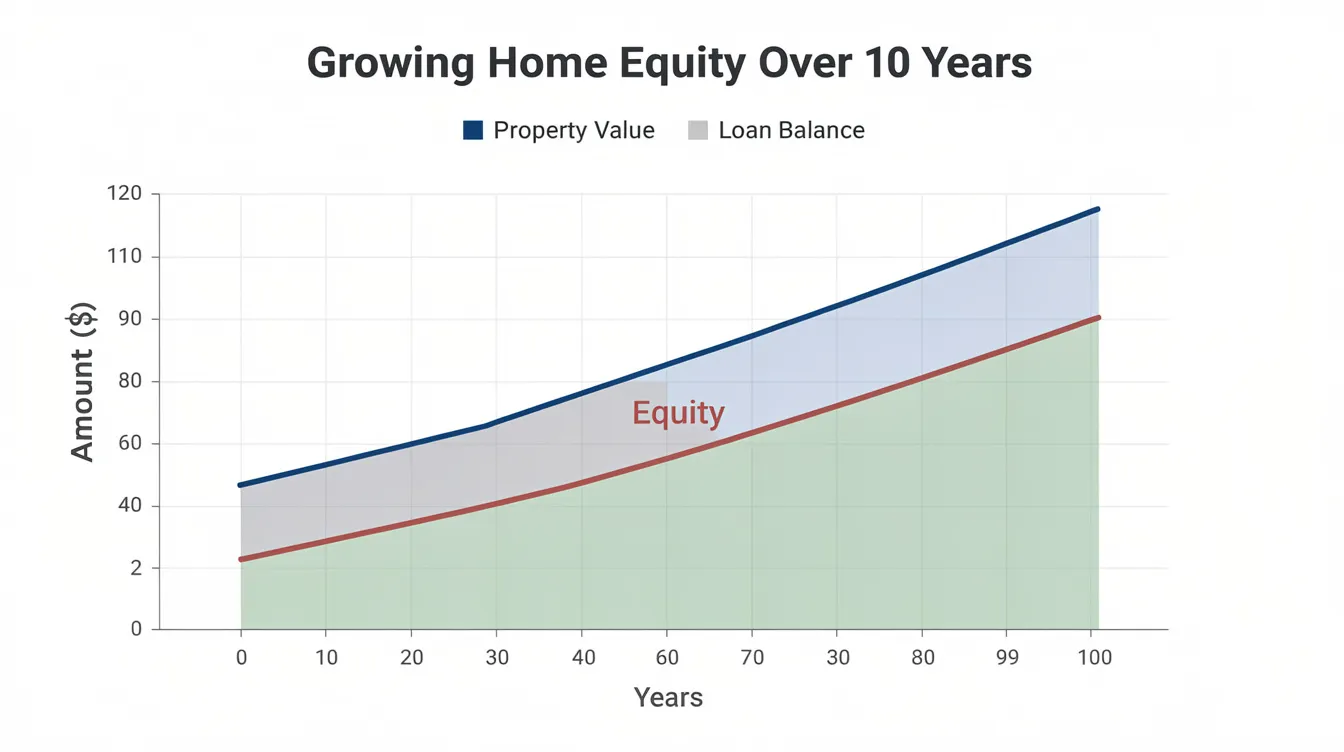
For comparison, resale homes recorded a median annualised return of 3.7%, while new private homes had a lower return of 2.7% annually on a broad market basis. Our city-fringe case study outperforms both medians, largely because of disciplined entry psf and a favourable location that drove steady rental demand and capital appreciation.
Comparative Analysis: Was the 10-Year City-Fringe Condo Worth It?
A 5.5–6.5% annualised return sounds reasonable – but was it the best use of the investor’s capital? The answer depends on what alternatives existed and how the investor values liquidity, diversification, and leverage.
Comparing Against Resale City-Fringe Condo Bought in 2014
A hypothetical comparable: a 750 sq ft resale unit in the same general area, purchased in 2014 at S$1,400 psf (S$1,050,000 quantum) from the resale market.
|
Criterion |
New Launch (S$1,700 psf) |
Resale (S$1,400 psf) |
|---|---|---|
|
Entry quantum |
S$1,275,000 |
S$1,050,000 |
|
ABSD outlay (7%) |
S$89,250 |
S$73,500 |
|
Immediate rental income |
No (3–4 yr construction) |
Yes (from month 1) |
|
Gross rental yield at entry |
~3.0% (on purchase price) |
~3.5–3.8% |
|
Expected 10-year CAGR |
~5.5–6.5% |
~4.0–5.0% |
|
Maintenance risk |
Lower (newer building) |
Higher (older fittings) |
The new launch commands a higher entry cost and delays rental income during construction, but typically benefits from stronger capital appreciation and lower maintenance. The resale unit offers immediate cash flow and a lower quantum, making it accessible to more buyers with tighter budget constraints. The success of city-fringe investments can vary based on local buyer demand and market dynamics, so neither option is universally superior.
Comparing Against Non-Property Investments
Over the same 2014–2024 period:
-
S&P 500 / MSCI World index fund (with dividends reinvested): CAGR of approximately 8–10% p.a. nominal. No leverage required, fully liquid, diversified across hundreds of companies and geographies.
-
Singapore Savings Bonds / 10-year SGS: Yields fluctuated between 1.5–3.5% p.a. over the decade, with capital preservation but minimal real growth.
The condo’s 5.5–6.5% CAGR on equity looks competitive with bonds and falls within range of global equities – but the comparison is imperfect. The property return is amplified by leverage: the investor controls a S$1.275 million asset with roughly S$320,000 of equity. Without leverage, the underlying capital appreciation of ~2% p.a. and net rental yield of ~2–3% would be less compelling.
New private home prices are projected to rise 2 to 4% this year, and analysts forecast new home sales to hit 7,000 to 9,000 units this year – confidence signals that suggest the market still values city-fringe property as a viable long-term investment. In January 2024, 1,104 new units were sold, up from 373 in December – a sign that buyers remained active despite higher interest rates.
Risk-Adjusted View: Volatility, Leverage and Concentration
While leveraged property may show attractive absolute returns, it concentrates risk into a single asset in one country, one district, and one building. Stress scenarios that could have significantly worsened outcomes include:
-
Sharp interest rate spike without rental increase. A sustained 4.5%+ mortgage rate with flat rents could have turned positive cash flow negative, forcing the investor to top up monthly from savings.
-
Policy risk. Further cooling measures – such as the ABSD hike to 20% for second properties in 2023 – would have dampened resale demand, compressing exit psf.
-
Project-specific issues. Construction defects, management disputes, or a neighbouring development launching at a discount could suppress both rent and resale value. Regeneration of neighbourhoods can contribute to overall price growth, but the reverse – stalled redevelopment or oversupply – is equally possible.
A diversified equity portfolio carries its own volatility, of course, but it offers daily liquidity and far less concentration risk. The right answer depends on the investor’s broader portfolio, risk tolerance, and ability to absorb negative cash flow in stress periods.
Common Pitfalls Over a 10-Year City-Fringe Hold and How to Avoid Them
Many investors focus on entry price and expected capital gains but forget the operational, policy, and financing risks that emerge over decades. Here are the three most common pitfalls – and practical ways to avoid them.
Overestimating Rental and Underestimating Vacancies
Using top-of-market rents with 0% vacancy leads to unrealistically high projected yields. In reality, tenant turnover, marketing downtime, and negotiated rent reductions during soft periods (as seen post-COVID) can reduce gross rental by 8–12% over a full cycle.
Guidance: Base-case modelling should use conservative rent benchmarks (e.g. 25th percentile of comparable units rather than asking rents), assume 5–10% vacancy, and factor in realistic agent fees. Data from URA rental indices, not agent marketing brochures, should form the foundation of any projection.
Ignoring Interest Rate and Refinancing Risk
A move from 1.5% to 3.5% interest on a S$950,000 loan increases monthly instalments by over S$800 – enough to turn a marginally positive cash flow into a monthly shortfall. Over the 2021–2023 period, many Singapore landlords experienced this exact squeeze.
Practical mitigations:
-
Stress-test affordability at 4.5% or higher before committing to a purchase.
-
Maintain a reserve fund covering at least 12 months of mortgage instalments.
-
Review loan packages periodically for refinancing opportunities; switching from a floating-rate to a fixed-rate package at the right point in the cycle can save tens of thousands over a 10-year holding period.
Lack of Exit Strategy and Time Horizon Discipline
Many owners hold indefinitely without revisiting assumptions. They may miss a good exit window or hold into oversupply periods when new projects and more options flood the segment, suppressing resale prices.
Recommendations:
-
Set clear review checkpoints at the 5th and 10th year, tied to target IRR thresholds (e.g. “if annualised return falls below 4% by year 5, reassess hold vs sell”).
-
Consider opportunity cost versus new developments or other asset classes at each review point.
-
Monitor quarter-by-quarter resale transaction data for comparable units to sense whether the market is at a cyclical peak or trough.
Disciplined planning and realistic modelling can turn a city-fringe new launch into a robust long-term component of a broader portfolio – but only if the investor treats it as a business, not a set-and-forget savings account.
Conclusion and Next Steps
A city-fringe new launch bought at launch price can deliver reasonable 10-year returns – our base case produced approximately 5.5–6.5% annualised on equity – if entry psf is disciplined, rental and holding cost assumptions are realistic, and the investor maintains financial flexibility through interest-rate cycles. But outcomes are not automatically superior to resale alternatives or diversified portfolios; every advantage of leverage also carries a mirror-image risk.
Actionable next steps for readers:
-
Rebuild the 10-year cash flow model using your own numbers – your actual entry psf, loan terms, and conservative rent estimates – rather than relying on developer marketing figures.
-
Stress-test scenarios with 20% lower rent and 200 basis points higher interest rates to see if you can sustain negative cash flow for 12–18 months.
-
Define clear exit criteria (e.g. target CAGR of 5% or absolute profit threshold) before you sign the option to purchase.
-
For developers and consultants, benchmark future city-fringe pricing and product positioning against the decade-long performance highlighted in this case study.
Related topics to explore next:
-
10-year performance comparison of core central vs city-fringe vs OCR condos in Singapore.
-
Impact of different loan structures and prepayment strategies on property IRR.
-
How government land sales and upcoming master plans may reshape the next wave of city-fringe growth.
Additional Resources
-
URA REALIS transaction data and rental indices for RCR projects launched around 2013–2015 – the primary source for benchmarking entry and exit psf, and validating rental assumptions against actual resale transactions.
-
10-year cash flow template: A simple spreadsheet allowing investors to plug in their own psf, rent, vacancy rate, interest rate, and operating costs to compute personalised CAGR and net profit across the full holding period.
-
Singapore residential cooling measures (2010–2024): A concise reading list covering ABSD revisions, LTV adjustments, and TDSR/MSR frameworks – essential context for understanding how policy changes affect long-term investment returns.
-
For institutional readers and developers: Professional consultancies analyse long-term returns when assessing feasibility of new residential and mixed-use projects in city-fringe locations, incorporating sensitivity analysis on entry pricing, construction costs, and absorption rates to inform land acquisition and product design decisions.

