

Introduction
Lentor launch buyers have enjoyed some of the most talked-about price appreciation in Singapore’s Outside Central Region over the past four years. But how much of that appreciation translates into real gains once progressive payments, mortgage interest, buyer’s stamp duty, and transaction costs are factored in? This case study breaks down the difference between paper gains and real gains for buyers across the Lentor precinct-from Lentor Modern in 2022 through Lentor Gardens Residences in 2026-and shows why the headline numbers can be deeply misleading.
The short answer: understanding the distinction between paper gains and actual gains is crucial for property investors. Many Lentor launch buyers see impressive paper gains-Lentor Modern recorded a 41.82% price increase from 2022 to 2023, and some larger units have profits near $590,000-but net realised returns after interest, BSD, seller’s stamp duty, and progressive payment costs are consistently 25–40% lower than the headline figure. Paper gains reflect theoretical market appreciation of a property; real gains represent actual cash profit after sale, accounting for costs. Paper gains can create an illusion of wealth that does not translate to cash unless realized.
This is a Singapore-focused investment case study using actual Lentor launch prices, resale and subsale transaction data up to mid-2026, and realistic financing assumptions. It is not a price prediction piece, nor does it constitute financial or investment advice-readers should conduct their own due diligence. The target audience includes HDB upgraders and property investors weighing Lentor Gardens Residences or the next Lentor GLS launch, plus existing Lentor Modern, Lentor Hills Residences, or Lentor Mansion owners considering their exit strategy.
Here is what you will gain from this article:
-
How big Lentor paper gains actually were across launches from 2022 to 2026
-
How progressive payment interest erodes those gains during construction
-
Unit-type differences-two-bedroom vs three bedroom units vs four-bedroom-in true ROI
-
A forward-looking scenario for Lentor Gardens buyers entering in 2026
-
How to model your own Lentor Gardens scenario before committing capital
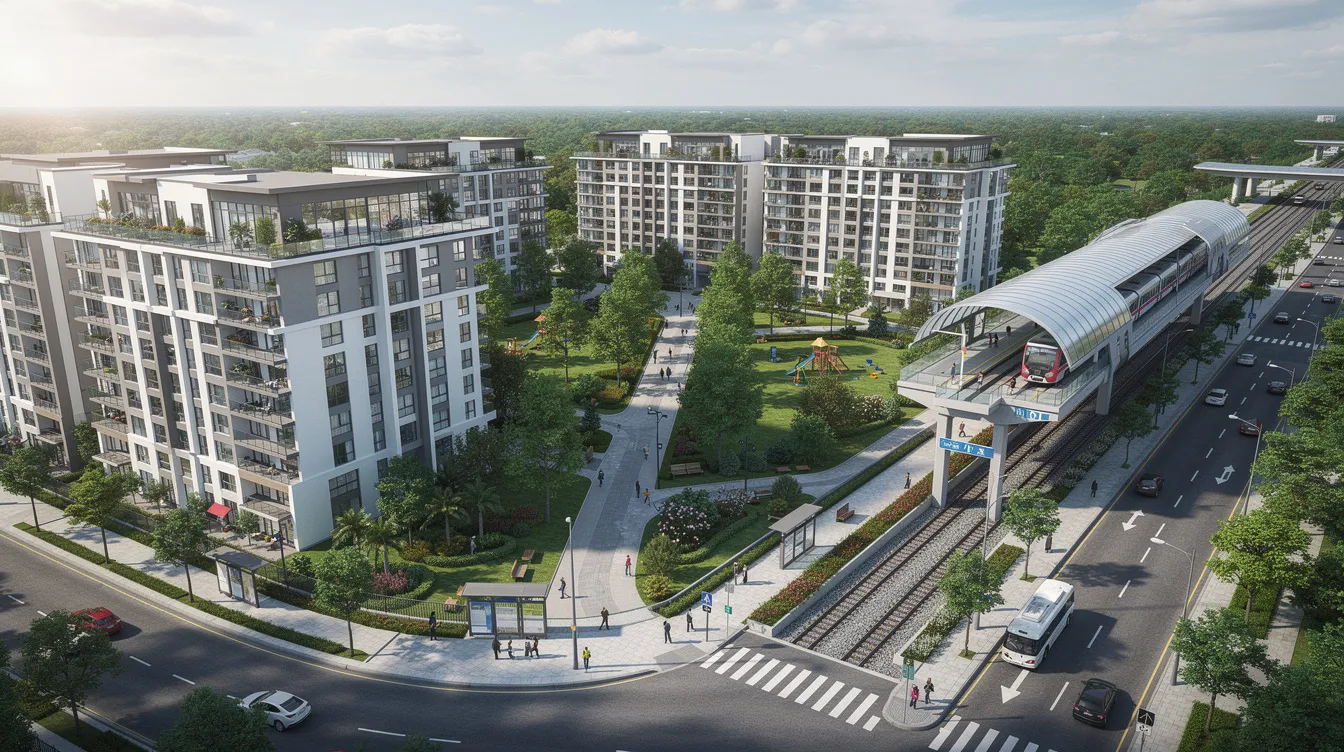
Understanding Paper Gains vs Real Gains in New Launch Condos
Before diving into Lentor-specific numbers, it is essential to establish what “paper gain” and “real gain” actually mean for new launch condos in Singapore. These two figures can diverge sharply-and the gap between them is where many early buyers miscalculate their true returns. Actual investment returns depend on the timing and amount of cash flows involved in property investment, not simply on the difference between buy and sell price.
What Are Paper Gains for Lentor Launch Buyers?
Paper gains are the difference between the latest bank valuation or transacted subsale price and the original option-to-purchase (OTP) price at launch. They represent the theoretical market appreciation visible on paper-before any costs are deducted.
Consider a concrete Lentor example: a Lentor Modern 3BR unit of approximately 969 square foot purchased at launch in September 2022 for around $1.94M (≈$2,000 psf). By early 2025, comparable units transacted at approximately $2,450 psf, placing the unit’s market value near $2.37M. That creates a headline paper gain of roughly $430K-about 22% over 2.5 years. Marketing materials and property portals routinely highlight this simple price delta without subtracting interest, duties, or fees.
For under-construction projects-Lentor Mansion with TOP in 2028, or Lentor Gardens Residences with TOP projected around 2029-most owners hold only paper gains until completion or sale. During construction under the Progressive Payment Scheme, buyers often see paper gains but not actual profits. Market valuation increases during construction do not guarantee profit realization upon sale.
What Are Real Gains After Progressive Payments and Costs?
Real gains equal the net cash (and CPF) left in your hand after selling-sale proceeds minus every dollar of cash and CPF deployed, accrued CPF interest, buyer’s and seller’s stamp duty, legal and agent fees, and cumulative mortgage servicing costs over the entire holding period. Investors should account for transaction costs, financing expenses, and taxes to determine net cash profit.
For new launch condos, the Progressive Payment Scheme allows staggered payments over the construction period, meaning bank interest starts low but grows as construction milestones trigger additional disbursements. Cumulative mortgage servicing costs can erode actual returns on property investment-especially in the 2023–2025 high-rate environment when floating mortgage rates averaged roughly 3.5–4.7%. For Lentor modern buyers who leveraged heavily at 75% LTV, this interest drag is material.
To quantify this gap properly, we need to understand how the Progressive Payment Scheme works in practice and then overlay it on actual Lentor launch and resale data.
How the Progressive Payment Scheme Affects Real Returns
The Progressive Payment Scheme (PPS) structures payments across construction milestones: typically 5% booking fee, 15% upon exercise of the OTP, then staged disbursements of 5–10% each tied to foundation, structural completion, partition walls, mechanical and electrical works, and finally TOP/CSC. Buyers utilizing the Progressive Payment Scheme have cash outlays tied to construction milestones.
Interest is charged only on the disbursed portion, so effective leverage-and risk-ramps up gradually over the 3–4 year construction period. For the Lentor Hills estate launches between 2022 and 2026, this construction period coincided with a sharp rise and subsequent stabilisation of interest rates, materially altering net gains compared with the ultra-low-rate years of 2015–2019.
The rest of this article overlays the PPS interest curve onto actual Lentor launch pricing and resale market data to show exactly how much “profit” survives the journey from booking to bank account.
Lentor Launch Timeline and Price Context (2019–2026)
The Lentor area has transformed from a quiet pocket of District 26 into one of the most closely watched new launch clusters in the Outside Central Region. Understanding the chronology and entry price of each project is essential context for evaluating paper gains.
Key Lentor Launches and Their Entry Prices
Here is a summary of major Lentor projects in chronological order, drawing on government land sales records and actual pricing from launch weekends:
|
Project |
Launch Period |
Avg Launch PSF |
Land Cost (PSF PPR) |
Notable Features |
|---|---|---|---|---|
|
Lentor Modern |
Sept 2022 |
~$2,107 |
~$1,060 |
Integrated mall with Lentor Modern Mall, direct access to Lentor MRT Station |
|
Lentor Hills Residences |
Mid-2023 |
~$2,115 |
~$1,060 |
Adjacent to Lentor Hills estate, near St Nicholas Girls’ School |
|
Hillock Green / Lentoria |
Late 2023–Early 2024 |
~$2,100–$2,300 |
Various |
Mid-range entry within Lentor precinct |
|
Lentor Mansion |
March 2024 |
~$2,104 (launch) / $2,257 (avg achieved) |
~$1,108 |
Lentor Mansion achieved the highest average price at $2,257 PSF |
|
Lentor Central Residences |
March 2025 |
~$2,214 |
~$1,130 |
Lentor Central Residences launched at $2,214 PSF with 93% take-up |
|
Lentor Gardens Residences |
Expected July 2026 |
~$2,100 (est.) |
$920 |
Lowest land cost at $920 PSF PPR; the largest land plot in recent Lentor GLS batches |
These launches reflect rising underlying land costs and estate maturation, creating apparent paper gains for early buyers of earlier launches. Each successive record land bid by developers signals higher future launch pricing, which makes earlier projects look increasingly attractive on paper. Lentor Gardens has the lowest land cost at $920 PSF PPR among new launches, and Lentor Gardens Residences is estimated to launch around $2,100 PSF-potentially a low entry price relative to future projects.
This article focuses on 2–3 representative case study units from this timeline to illustrate the paper-to-real gains gap.
Early Resale and Subsale Signals from Lentor Modern and Peers
Lentor Modern serves as the first-mover benchmark. As the first project launched in the precinct with an integrated mall and direct access to Lentor MRT station on the Thomson East Coast Line, it attracted strong buyer demand. It achieved full sell-out, and by 2025–2026, sufficient resale and subsale caveats were available to evaluate the full PPS holding period.
Lentor Modern’s resale prices have set a benchmark for future launches. Early subsale gains of up to 21% were reported following TOP for select premium units. Lentor Modern’s average profit per resale transaction is about $313,600. Three-bedroom units in Lentor Modern had average gains of $349,200, while two-bedroom 732 sqft units average $150,000 gain after 3 years. Lentor Modern’s annualised returns range from 0.9% to 6.3% for resales-a wide spread that depends heavily on unit type, floor, and timing.
Early subsale signals from Lentor Hills Residences and Lentor Mansion options are more limited in sample size, but transaction data from these projects broadly confirms sustained demand in the Lentor area.
This headline price growth sets the stage-but investors need to know how much of it survives after financing and costs.
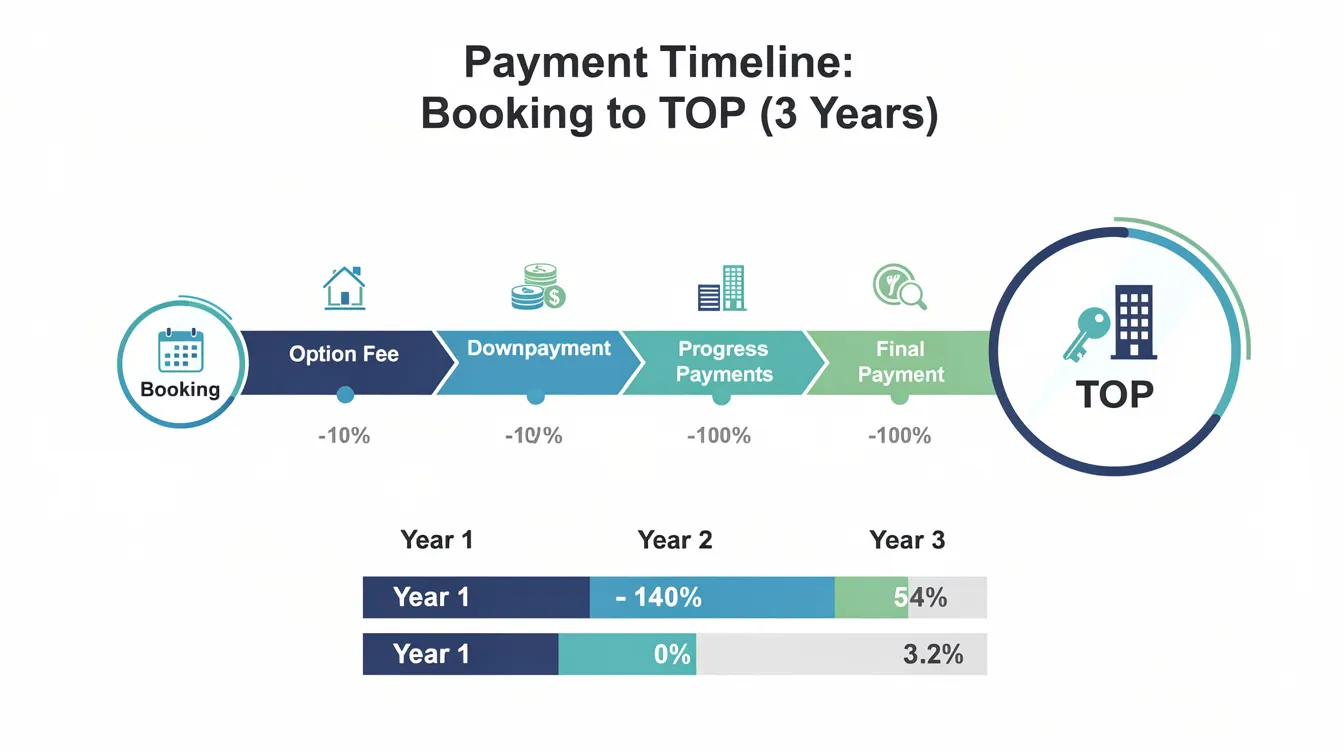
Case Study Framework: Comparing Paper Gains vs Real Gains
AESTHETIC HAVENS uses a standardised framework to evaluate true returns for launch buyers, applied here to Lentor projects. This section explains the inputs, methodology, and benchmarks we use before presenting concrete case studies.
Key Inputs We Track for Each Lentor Launch Deal
For every Lentor launch deal, we collect and model the following market data points:
-
Launch price PSF and quantum – e.g., Lentor Modern 3BR 969 sqft at ~$1.94M ($2,000 psf)
-
Sale/resale price and date – e.g., sold in early 2025 at ~$2.37M ($2,450 psf)
-
Timeline of disbursements under PPS – based on standard BCA construction stages for the specific build period (2022–2025 for Lentor Modern)
-
Prevailing floating mortgage rates for each year of construction – averaging ~1.8% in early 2022, rising to ~3.5–4.5% in 2023–2024, easing to ~3% in 2025, and ~2.1–2.2% in early 2026
-
Buyer profile assumptions – Singapore citizen, no ABSD (own-stay upgrader who sold HDB), 75% LTV, 25-year tenure
Sensitivity analysis for buyers holding multiple private property assets (ABSD at 20%+, higher equity requirement) is discussed separately. The buyer profile materially changes the outcome.
How We Convert These Inputs into Real ROI
The conversion from paper gain to real gain follows five steps:
Step 1: Compute simple paper gain = sale price – launch price. This is the number that appears in property portals and marketing decks.
Step 2: Add up all cash and CPF deployed across the construction years-downpayment tranches, buyer’s stamp duty, legal fees, and any out-of-pocket costs during construction.
Step 3: Estimate total interest paid by integrating outstanding loan balances under PPS with actual rate bands for each year. Interest is only charged on disbursed amounts, so a progressive payment calculator is essential.
Step 4: Deduct seller’s stamp duty (if sold within the holding period under current SSD rules), agent commissions (~2% of resale price), legal fees, and accrued CPF interest (2.5% p.a. on CPF used).
Step 5: Calculate net gain and annualised IRR based on actual cash flows over the holding period-not just entry and exit prices.
Benchmarking Against Alternative Strategies
To provide context, AESTHETIC HAVENS benchmarks each Lentor launch case against three alternatives:
-
Holding HDB and not upgrading – baseline equity growth at ~3–4% per year in a mature estate, with no PPS interest drag
-
Buying a comparable resale OCR condo in 2022–2024 instead of a Lentor launch-immediate rental income, no construction risk, but higher immediate interest burden
-
For business owners: purchasing a small industrial unit vs a Lentor launch purely for investment, leveraging AESTHETIC HAVENS’ industrial property expertise for a total-return comparison
These comparisons help readers see whether a Lentor launch truly “wins” on a risk-adjusted, cashflow-adjusted basis, or whether the capital appreciation story only holds under optimistic assumptions about market conditions.
Case Study 1: Lentor Modern 3-Bedroom Buyer (2022 Launch to 2025 Resale)
This is the flagship case study. Lentor Modern was the first integrated development in the Lentor estate, with three residential towers, three retail shops forming the Lentor Modern Mall, and direct access to Lentor MRT Station. It generated enormous buzz on launch weekend in September 2022. With TOP achieved and resale caveats now available, we can evaluate the full PPS period with real numbers.
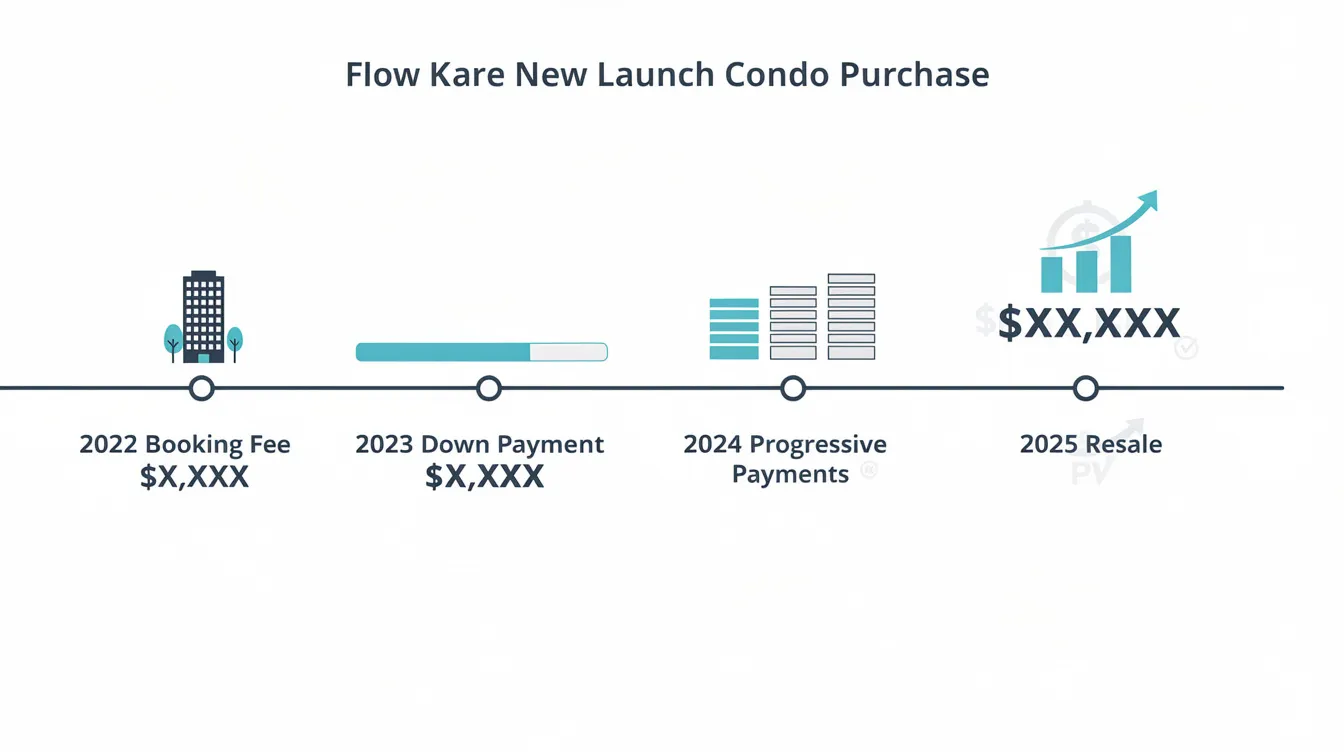
Paper Gains: Headline Profit Looks Exceptional
Here is a realistic scenario using actual pricing:
-
Buyer books a 969 sqft 3BR unit in September 2022 at $2,000 psf – total launch price ~$1.94M
-
By early 2025, comparable Lentor Modern resale units transact at ~$2,450 psf – resale price ~$2.37M
-
Headline paper gain ≈ $430K (≈22% over ~2.5 years)
Some larger units in Lentor Modern have profits near $590,000 at the top end. Lentor Modern’s larger units show 5% annualised gains on a gross basis. These are the numbers that feed into marketing narratives about “$400K+ profit in under 3 years” and drive buyer demand for subsequent Lentor launches.
But paper gains reflect theoretical market appreciation. The question is what happens when you subtract every cost incurred from booking to bank transfer.
Real Gains After Progressive Payment Interest and Costs
Here is the progressive payment schedule for this unit, overlaid with actual financing costs:
2022 (Months 0–9):
-
5% booking fee + 15% on exercise + 5% foundation stage = ~25% of purchase price deployed (~$485K in equity/CPF). Loan drawdown begins on the financed portion.
2023 (Months 10–24):
-
Additional 10–15% drawn as superstructure rises. Outstanding loan balance climbs. Mortgage rates in this period averaged ~3.5–4.5%.
2024 (Months 25–36):
-
Further 20–25% drawn for walls, partitions, M&E, and roof. By end-2024, total drawdown reaches ~70–75% of purchase price. Interest is now accruing on a substantially larger base.
2025 (Months 37+):
-
Final disbursements at TOP/CSC. Buyer sells shortly after TOP, clearing the SSD window (just past 3 years under the pre-July 2025 SSD regime).
Cost summary:
|
Cost Item |
Estimated Amount |
|---|---|
|
Total mortgage interest paid (blended ~3.5% over 2.5–3 years) |
~$90,000–$110,000 |
|
Buyer’s stamp duty on $1.94M |
~$57,000 |
|
Legal and miscellaneous fees |
~$5,000–$7,000 |
|
Agent commission at resale (2% of $2.37M) |
~$47,000 |
|
Accrued CPF interest (if CPF used for downpayment) |
~$10,000–$15,000 |
|
Total costs |
~$209,000–$236,000 |
Net real gain after costs ≈ $200,000–$260,000 instead of $430K paper gain. Annualised IRR calculated on actual cashflows comes to approximately 6–7%, rather than the superficial 8–9% implied by the price-only view.
This is still a respectable result. But 25–40% of the headline “profit” disappears once PPS interest, stamp duties, and transaction costs are included. Cumulative mortgage servicing costs can erode actual returns on property investment significantly over even a relatively short hold.
What This Means for Lentor Gardens and Later Launch Buyers
Lentor Gardens buyers entering at the estimated launch price of ~$2,100 psf in 2026 and hoping to exit after nearby future launches price at $2,700–$2,800 psf must allow for a similar 25–40% haircut from paper to real gains. Higher interest rates (e.g., 4% instead of 3%) or a longer holding period before resale further reduce real ROI.
Lentor Gardens Residences’ estimated breakeven price is $2,219 PSF-meaning any exit below this level results in a loss after costs, not merely a smaller gain.
The next case study shows how a smaller unit behaves under the same market conditions.
Case Study 2: Lentor Modern 2-Bedroom Buyer (2022 Launch to 2025 Resale)
Smaller units often attract higher PSF on the resale market but generate lower absolute quantum gains. Unit size influences investment outcomes; larger units often yield better returns than smaller ones. Here is how the numbers play out for a 2BR Lentor Modern buyer.
Paper Gains: Smaller Quantum, Smaller Headline Profit
-
732 sqft 2BR purchased at launch in September 2022 for ~$1.45M ($1,980 psf)
-
Resold in 2025 at ~$1.60M (~$2,185 psf)
-
Headline paper gain ≈ $150,000 (~10%)
Two-bedroom 732 sqft units average $150,000 gain after 3 years. In percentage terms, this looks less impressive than the three bedroom units, which benefited from stronger owner-occupier and family-sized demand in the Lentor estate.
Real Gains: Interest and Transaction Costs Bite Harder
While the mortgage quantum is smaller, transaction costs are proportionally heavier relative to the gain:
|
Cost Item |
Estimated Amount |
|---|---|
|
Buyer’s stamp duty on $1.45M |
~$43,000 |
|
Total mortgage interest (blended ~3.5%, 75% LTV) |
~$60,000–$70,000 |
|
Agent commission at resale (2% of $1.60M) |
~$32,000 |
|
Legal and miscellaneous fees |
~$5,000 |
|
Accrued CPF interest |
~$7,000–$10,000 |
|
Total costs |
~$147,000–$160,000 |
Net real gain after costs ≈ $0–$50,000 instead of $150K paper gain. Annualised IRR drops to roughly 0.9–3%, comparable to or barely better than some balanced funds-but with property-specific risks and illiquidity.
The insight is stark: smaller Lentor units show a much larger distortion between paper and real gains because fixed costs (BSD, legal fees, agent commission) consume a disproportionate share of the smaller profit quantum.
Implications for Investors Eyeing 1–2 Bedroom Units in Lentor Gardens
Lentor Gardens 1–2BR buyers banking on quick flips after future launches at higher PSF need to model realistic net outcomes before committing. For yield-focused property investors, compressed rental yields (~2.8–3.2%) and rising property taxes for non-owner-occupied units further squeeze real returns compared with larger family units held for own stay plus long-term capital appreciation.
The available units in Lentor Gardens’ unit mix will include a range of unit types. Investors should carefully evaluate whether the efficient layouts and lower entry price of smaller bedroom units actually translate to viable returns after all costs-or whether three bedroom units accounted for by owner occupiers offer a fundamentally better risk-return profile.
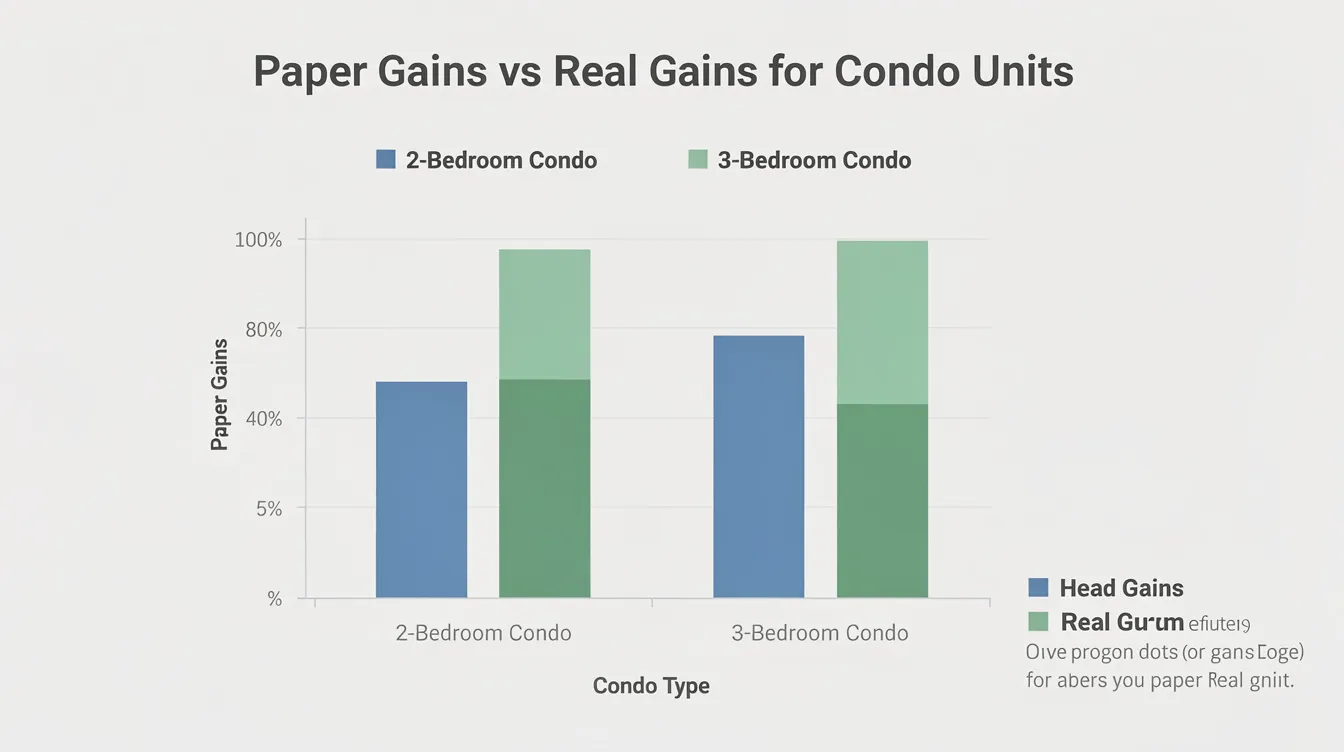
Forward-Looking Scenario: Lentor Gardens Buyer in 2026
This section is a scenario analysis-not a forecast. It uses the known Lentor Gardens land cost ($920 psf ppr, the lowest land cost among recent Lentor GLS sites) and observed actual pricing of neighbouring Lentor Central Plot 4 ($1,278 psf ppr) to model plausible outcomes. Lentor Gardens must undercut previous launches to attract buyers, and Lentor Gardens Residences is projected to launch around $2,100 psf.
Expected Paper Gains Driven by Higher Land Costs Nearby
The Lentor Gardens GLS site benefits from a significant cost advantage. Its land cost of $920 psf ppr is the lowest in Lentor, well below the record land bid for the Lentor Central plot at $1,278 psf ppr. This implies:
-
Lentor Gardens Residences fits an estimated launch price of ~$2,100 psf-potentially well below future projects in the Lentor precinct that may launch at $2,700+ psf once higher land costs flow through
-
If a 3BR unit at Lentor Gardens (say 990 sqft at ~$2.08M) is later valued at $2.6M once newer stock trades at higher PSF, the headline paper gain could reach ~$500K
-
Major transit nodes typically boost property values by 5% to 15%, and the North-South Corridor will open in phases by 2029-the NSC is a 21.5-kilometer dual-layered transportation artery that will reduce commute times by at least 15 minutes, reinforcing capital appreciation prospects for the Lentor area
This type of narrative will be pushed aggressively during Lentor Gardens’ launch weekend. But how much of that paper gain actually survives?
Real Gains After Progressive Payments, 2026–2029 Build Period
Here is a simplified 7-year scenario for a Lentor Gardens 3BR buyer:
Timeline and assumptions:
-
Buyer enters July 2026, construction runs 2026–2029, TOP ~2029, holds and sells in 2032 (to clear the post-July 2025 SSD window of 4 years)
-
Purchase price: ~$2.08M at ~$2,100 psf
-
Loan: 75% LTV = ~$1.56M
-
Interest rate: 3–3.5% for 2026–2028, moderating to 2.8–3% from 2029–2032
-
PPS disbursements ramp gradually; cumulative interest over 6–7 years may reach ~$180,000–$220,000 for the $1.56M loan
-
Exit price at 2032: ~$2.58M (conservative, assuming ~$2,600 psf)
Cost stack:
|
Cost Item |
Estimated Amount |
|---|---|
|
Buyer’s stamp duty |
~$60,000+ |
|
Cumulative mortgage interest (7 years) |
~$180,000–$220,000 |
|
Property tax (non-owner-occupied rates, if applicable) |
~$15,000–$25,000 |
|
Maintenance fees during vacancy/construction |
~$10,000–$15,000 |
|
Agent commission at resale (2%) |
~$52,000 |
|
Legal fees and miscellaneous |
~$7,000 |
|
Accrued CPF interest |
~$20,000–$25,000 |
|
Total costs |
~$344,000–$404,000 |
Indicative net gain:
-
Paper gain at 2032 sale: ~$500K
-
Less interest and costs: ~$344,000–$404,000
-
Net real gain: ~$100,000–$156,000, with IRR in the 3.5–4.5% range
Stress-test with a lower exit price ($2,400 psf instead of $2,600) or longer vacancy, and net gain compresses further-potentially to high-2% IRR territory, below inflation-adjusted expectations.
How Long Should a Lentor Gardens Buyer Hold?
A 7–10 year horizon is more realistic for capturing full precinct maturation, the North-South Corridor catalysts (the Land Transport Authority has confirmed phased opening by 2029), and new developments around St Nicholas Girls’ School and the broader Lentor Hills estate.
Selling too early destroys value:
-
Selling in Year 1 after purchase (2027): 16% SSD under new rules = ~$413K penalty on a $2.58M sale-wiping out the entire paper gain
-
Selling in Year 2 (2028): 12% SSD = ~$310K penalty
-
Selling in Year 3 (2029, near TOP): 8% SSD = ~$206K penalty
-
Selling in Year 4 (2030): 4% SSD = ~$103K penalty
-
Year 5+ (2031 onwards): 0% SSD
Seller’s Stamp Duty can significantly reduce realized gains if sold within the holding period. The SSD regime change effective 4 July 2025 extends the holding period from 3 to 4 years with rates increased by 4 percentage points per tier. For Lentor Gardens buyers, this means patience is not optional-it is a mathematical requirement.
AESTHETIC HAVENS’ view: Lentor Gardens Residences fits primarily as a capital appreciation play over a medium-to-long horizon, not a short-term cashflow instrument. The track record of the Lentor precinct supports sustained demand, but only for buyers who structure their financing and timeline correctly.
Common Misconceptions and Pitfalls for Lentor Launch Investors
Before committing to any Lentor launch-especially Lentor Gardens-use this as a self-checklist against the most common errors we see among new launch condo buyers.
Misreading PSF and Ignoring Quantum and PPS Interest
Buyers often fixate on PSF comparisons-“below $2,200 psf must be cheap”-without modelling actual monthly interest and total lifetime interest cost under PPS. A low entry price per square foot means nothing if total quantum pushes financing costs beyond what your expected exit price can absorb.
You need to calculate both:
-
Entry quantum affordability: all-in cash and CPF needed over 3–4 years of construction, not just the booking deposit
-
Total financing cost: under realistic rate scenarios (test at 3.5% and 4.5%), mapped against the specific PPS drawdown schedule for your project
Assuming Future GLS Prices Guarantee Your Exit Price
Just because the Lentor Central plot attracted a record land bid at $1,278 psf ppr does not guarantee that your Lentor Gardens unit will sell at a corresponding markup. Market trends can shift. Factors that break the price chain include:
-
Oversupply in specific bedroom units across the Lentor precinct-multiple projects with similar unit mix competing for the same resale market
-
Changes to cooling measures or market conditions
-
Macroeconomic downturn or rental oversaturation as all Lentor projects reach TOP within a narrow window
Underestimating Stamp Duties and CPF Accrued Interest
BSD alone on a $2M purchase consumes ~$57,000–$65,000. For multiple-property investors, ABSD can exceed 20% of purchase price-potentially hundreds of thousands on a Lentor quantum.
Accrued CPF interest at 2.5% per year compounds quietly. Over a 7-year hold, CPF used for a $500K downpayment would accrue ~$90,000+ in interest that must be returned to your CPF account upon sale. This silently erodes the apparent equity build-up and is frequently ignored in “profit” calculations shared on property forums.
Not Stress-Testing Cashflow for Rate Spikes and Delays
Buyers should test affordability at 4.5% interest and model 6–12 month construction delays. Some pandemic-era projects experienced exactly this scenario. Forced selling due to cashflow strain often crystallises minimal or even negative real gains despite healthy paper gains on a property portal screen.
A buyer who cannot comfortably service progressive payments at 4.5% for the full construction period should reconsider their unit type, quantum, or whether a Lentor launch is the right vehicle at all.
Conclusion and Next Steps for Lentor Launch Buyers
Lentor launches have generated strong paper gains-particularly for larger units in Lentor Modern and Lentor Mansion, where three-bedroom units accounted for the bulk of six-figure profits. Larger three-bedroom units show 5% annualised gains on a gross basis, and some individual units have recorded profits approaching $590,000.
But progressive payments, interest, duties, and fees consistently trim 25–40% off those headline gains. For Lentor Gardens buyers entering in 2026, realistic long-term planning is essential. Not all projected paper upside will flow into your bank account. The gap between paper and real gains is not a flaw in the investment-it is a structural feature of how new launch condos work under the Progressive Payment Scheme.
Actionable next steps:
-
Model your own case using conservative exit prices and 3–4% mortgage rates over the full construction and holding period
-
Decide if you are an end-user or pure investor-choose unit type accordingly (3–4BR for long-horizon families and owner occupiers vs 1–2BR only with clear rental or niche strategy)
-
Compare the Lentor launch option against resale or industrial alternatives in the same budget, particularly if you are a business owner
-
Prepare financing buffers for at least +1.5% interest above current headline rates
-
Understand the new SSD regime before committing: any acquisition after 4 July 2025 requires a minimum 4-year hold to avoid penalty
For further context, consider exploring analyses on industrial property vs residential launch returns in Singapore, the impact of GFA harmonisation on perceived PSF and value, and how the North-South Corridor may influence both OCR residential and industrial rents across the central region.
AESTHETIC HAVENS invites readers to request a personalised Lentor or industrial portfolio review that includes a full paper vs real gains breakdown under PPS-tailored to your specific buyer profile, financing structure, and investment horizon.
FAQ: Paper Gains vs Real Gains for Lentor Launch Buyers
Are early Lentor Modern buyers still in profit after all costs?
Most early 3BR+ Lentor Modern buyers are still comfortably in profit after PPS interest and transaction costs, with net gains often in the mid-to-high six figures for premium stacks. Three-bedroom units in Lentor Modern had average gains of $349,200, and Lentor Modern’s average profit per resale transaction is about $313,600. However, 2BR buyers face tighter margins, and some smaller unit holders may find net real gains close to breakeven after all deductions.
Do Lentor Gardens buyers have the same upside as Lentor Modern buyers did?
Upside exists due to Lentor Gardens’ lowest land cost ($920 psf ppr) and higher nearby GLS bids signalling rising launch pricing for future projects. However, later entry into a more mature price level, combined with potentially higher interest rates during construction and the extended SSD holding period, means percentage gains are likely lower and slower than what Lentor Modern early buyers experienced.
How does progressive payment compare to buying a completed resale unit in terms of real return?
PPS reduces interest exposure in early construction years since you pay interest only on disbursed amounts. However, it extends your total financing exposure over the 3–4 year build period without rental income. Resale buyers pay full mortgage interest immediately but can generate rental income from day one, fundamentally changing the net ROI dynamics. The right choice depends on your cashflow profile and investment timeline.
Is it safer to buy larger or smaller units in Lentor if I’m focused on real gains?
Larger family units historically showed better net outcomes in the Lentor precinct due to stronger owner-occupier demand and more favourable absolute gain-to-cost ratios. Larger three-bedroom units show 5% annualised gains, while smaller units see their gains consumed disproportionately by fixed transaction costs. However, larger units require higher capital and concentrate risk in a single asset-suitability depends on your buyer profile.
How can I quickly estimate my own real gain from a Lentor launch purchase?
Use this rule-of-thumb: take your expected paper gain at exit, then subtract approximately 25–35% for interest and transaction costs under typical PPS conditions with 75% LTV. For a more precise figure, build a cashflow spreadsheet mapping each PPS drawdown against prevailing rates, or consult AESTHETIC HAVENS for a personalised breakdown. Remember that actual investment returns depend on the timing and amount of cash flows involved-simple percentage gains are misleading.
Does Seller’s Stamp Duty really matter for Lentor Gardens buyers?
Absolutely. Under the post-July 2025 SSD regime, selling within the first year triggers 16% SSD on the sale price-on a $2.5M unit, that is $400K, likely exceeding your entire paper gain. Even in year 3, 8% SSD ($200K) would consume most of a realistic net gain. Plan for a minimum 4-year hold from date of purchase, not from TOP, to avoid SSD entirely.
Does AESTHETIC HAVENS only advise on residential like Lentor?
AESTHETIC HAVENS primarily serves business owners and investors across residential, commercial, and industrial real estate. We can help compare Lentor-type launches against industrial or business-use properties from a total-return perspective-an especially relevant comparison for business owners who may achieve better risk-adjusted returns through industrial assets while avoiding the high BSD/ABSD burden of residential private property investment.


