


Singapore’s private residential property price index hit 218.3 in the first quarter of 2026, up 0.9% from the previous quarter, according to the Urban Redevelopment Authority. That headline number masks a split market: non-landed homes gained while landed properties slipped, a pattern worth understanding before you read too much into the aggregate figure.
TL;DR:
- The private residential property index increased 0.9% quarter on quarter, driven mainly by non-landed housing which rose 1.3%, while landed properties declined 0.4%.
- The index’s methodology adjusts for property features, so recent rises reflect genuine price movements rather than changes in transaction composition.
- With over 55,800 new private units expected to complete soon, supply levels will significantly influence market dynamics and pricing stability.
- Segment-specific trends indicate that landed properties are diverging from broader market growth, often reflecting larger transactions rather than overall market direction.
- To assess a property accurately, analyze project-level data, transaction volumes, supply pipeline, and personal affordability, rather than relying solely on macro index figures.
Table of Contents
- Snapshot: The Latest Property Price Index Readings
- What the Index Actually Measures
- How the Segments Are Diverging
- Where to Download the Official Index Data
- Where Singapore’s Property Prices Sit in Historical Context
- How to Use the Index When Making a Property Decision
- When Does URA Release New Index Data?
- What This Data Actually Means for Buyers Right Now
- Get a Property Reading Specific to Your Situation
- Sources
Snapshot: The Latest Property Price Index Readings
The first quarter 2026 numbers give a clear read on where Singapore’s housing market stands right now.
Here’s the breakdown by segment:
- Private residential index: 218.3, up 0.9% quarter on quarter
- HDB resale index: 203.4, up 1.2% quarter on quarter
- Landed properties: down 0.4% quarter on quarter
- Non-landed properties: up 1.3% quarter on quarter
URA also flagged a sizable pipeline of roughly 55,800 private residential units expected to complete over the next few years. That supply figure matters as much as the index number itself. A market absorbing tens of thousands of new units behaves differently than one facing a supply crunch, and it’s a big reason URA urged households to stay prudent given an uncertain macroeconomic backdrop.
What the Index Actually Measures
The Singapore property price index isn’t a simple average of sale prices. It’s built on a base of 1Q 2009, set at 100, so every reading tells you how far prices have moved since that starting point.
URA calculates the index using a method called Stratified Hedonic Regression. In plain terms, it strips out the effect of a property’s specific features (floor level, size, age, location) so what’s left reflects genuine price movement rather than a shift in what happened to sell that quarter. Without this adjustment, a quarter with more high-floor penthouse sales would look like a price boom even if nothing fundamental changed.
Pro Tip: Two quarters can show the same percentage change for very different reasons. Always check whether the movement came from actual price appreciation or a shift in the mix of properties transacted.
The inputs feeding the model come from three sources, according to Data:
- Caveats lodged with the Singapore Land Registry
- Stamp Duty data from the Inland Revenue Authority of Singapore
- Developer sales figures
Weights are calculated from transaction values across the preceding five quarters and get revised every three years. That’s a deliberate design choice: it keeps the index responsive to recent market composition without letting one unusual quarter distort the trend. The tradeoff is that the index tells you about the market broadly. It won’t tell you what a specific unit in a specific project is worth.
How the Segments Are Diverging
The gap between landed and non-landed performance in 1Q 2026 is the most interesting story in this data release, and it’s easy to miss if you only look at the headline 218.3 figure.
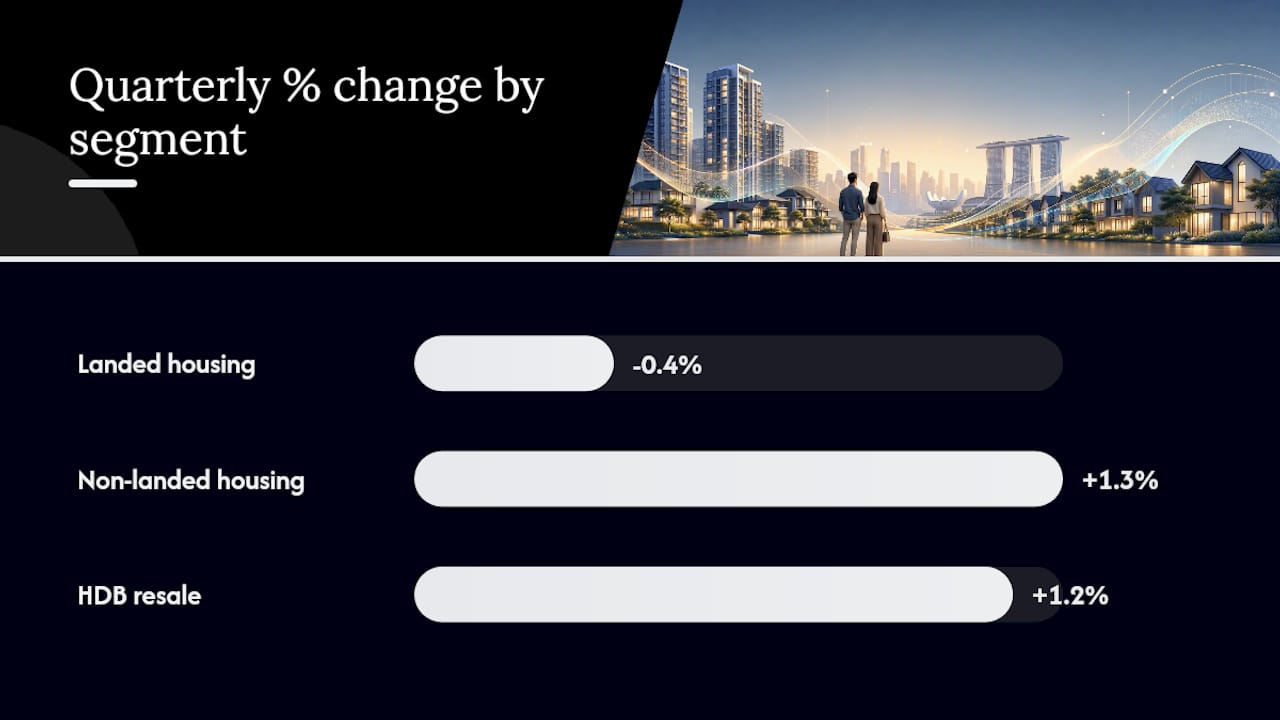
- Landed housing: down 0.4% quarter on quarter
- Non-landed housing: up 1.3% quarter on quarter
- HDB resale: up 1.2% quarter on quarter
Landed property is a small, tightly held slice of Singapore’s housing stock, so price swings there often reflect a handful of large transactions rather than a market-wide trend.
Pro Tip: If you’re evaluating a landed property purchase, don’t anchor your price expectations to the aggregate index; instead, consider compliance insights like those from AML Guard — AML/CTF Compliance for Australian Real Estate to ensure regulatory prudence. Pull the landed-specific series and compare it against recent transactions in that district instead.
Where to Download the Official Index Data
Getting the raw numbers yourself takes a few clicks once you know which platform serves which purpose.
- URA e-Service is the primary source for granular data. The Private Residential Time Series Statistics tool lets you select up to five series at once, choose quarterly or yearly frequency, and export the results as CSV files going back to 1975.
- data.gov.sg hosts the same URA dataset in a more analyst-friendly collection format, useful if you’re pulling data into a spreadsheet or model.
- SingStat publishes a consolidated table of property price indices covering HDB resale, private residential, office, retail, and industrial series side by side.
- SRX and TradingEconomics offer quick visual charts and trend lines, but both republish URA and SingStat figures rather than generating original data, so treat them as convenience tools, not primary sources.
Where Singapore’s Property Prices Sit in Historical Context
The private residential index has tracked continuously since 1975, though the current base of 1Q 2009 = 100 is what every modern reading gets measured against. That’s a 50-year window of data, which is long enough to see multiple property cycles, the 2008 financial crisis correction, several rounds of cooling measures, and the post-pandemic run-up.
Here’s how the two most recent quarters compare:
| Index | 4Q 2025 | 1Q 2026 | Quarterly Change |
|---|---|---|---|
| Private residential (1Q2009=100) | 218.3 | 218.3 | +0.9% |
| HDB resale (1Q2009=100) | 203.4 | 203.4 | +1.2% |
That’s the tension every reader needs to hold: the medium-term trend is a story of sustained appreciation over 17 years, but the quarter-to-quarter number is what actually moves buying and selling decisions today. Treat one quarter’s reading as a data point, not a verdict on where the market is headed next.
How to Use the Index When Making a Property Decision
The index tells you direction and magnitude at the market level. Turning that into a decision about a specific property takes a few more steps.
- Check the segment-specific series (landed, non-landed, HDB resale) rather than the aggregate figure alone
- Cross-reference URA’s supply pipeline data against the segment you’re buying into
- Look at transaction volumes, not just price, since a small volume can produce a misleadingly large swing
- Run the numbers against your own mortgage affordability, since index gains mean nothing if financing costs erase them
- Pull caveats or REALIS data for the specific project you’re considering rather than relying on the index alone
Pro Tip: A rising index in your target segment doesn’t mean every unit in it is a good buy. It means the average moved up. Always confirm the specific project against recent comparable transactions before you commit. For a deeper look at how financing shapes what you can afford, see this mortgage affordability guide.
When Does URA Release New Index Data?
URA publishes updated index figures four times a year, typically in the fourth week of January, April, July, and October, covering the quarter that just closed. Analysts and agents often plan repricing decisions or portfolio reviews around these release windows.
- URA quarterly release: fourth week of Jan/Apr/Jul/Oct
- SRX flash estimates: often published earlier, ahead of the official URA confirmation
- Habit worth building: hold off on major pricing decisions until the official quarterly figure lands, rather than acting on flash estimates alone
What This Data Actually Means for Buyers Right Now
It tells you the market direction at a macro level, and that’s a different question entirely. What I’d flag from this release is the divergence between landed and non-landed performance. It’s a reminder that “the market” is really several markets moving at different speeds.
Index readings like this one should be considered along with project-level transaction data, supply pipeline figures, and a client’s own mortgage affordability before any recommendation is made. That’s the gap between reading a headline number and making a sound property decision.
— Aman
Get a Property Reading Specific to Your Situation
Index data tells you what happened market-wide last quarter. It won’t tell you whether a specific unit is fairly priced, whether your financing works at current rates, or whether a segment showing growth on paper is the right fit for your goals. That’s where a local read matters more than the aggregate number.

Real estate consultants can help buyers, sellers, and investors in Singapore translate index movements like the 1Q 2026 figures into decisions grounded in project-level data, supply pipeline checks, and affordability analysis. Whether you’re weighing a landed purchase against its recent price dip or trying to time an HDB resale sale, a brief consultation can help clarify whether the broader trend applies to your specific case. Start with a property valuation check to see where your property or target purchase stands against the current market, or reach out for a market briefing tailored to your situation.
Sources
- Release of 1st Quarter 2026 real estate statistics | Urban Redevelopment Authority (URA)
- Data
- Private Residential Time Series Statistics – Property Market Information | URA
- Latest news & data – Property Price Indices | SingStat


