


Emerging markets deserve a measured allocation in any serious property investor’s portfolio. Emerging economies represent roughly 45–46% of global GDP but only about 20% of global equity market capitalization, a structural gap that points to underpricing relative to economic weight. The MSCI Emerging Markets Index is forecast to deliver the highest earnings-per-share growth among global regions, driven by AI adoption and resilient domestic demand. For property investors specifically, that macro backdrop translates into rising urbanization, expanding middle classes, and infrastructure build-out that supports real asset values.
TL;DR:
- Growth case: EM economies have historically grown at an annual rate higher than that of developed markets, and account for close to 80% of global economic growth.
- Portfolio role: A selective EM property allocation adds a growth engine and a diversification sleeve that behaves differently from US or developed-market real estate.
- Top risks to watch: Currency depreciation, title and legal uncertainty, and political risk are the three factors that most frequently derail cross-border property deals.
Aesthetic Havens, operating under ERA Realtors, specializes in exactly this kind of cross-border property advisory, helping investors navigate market selection, local partner vetting, and full transaction coordination.
Table of Contents
- Why invest in emerging markets? The macro evidence for property investors
- How does EM property exposure fit your portfolio?
- What are the main risks, and how do you manage them?
- How can you gain EM exposure? Comparing your options
- Practical checklist and timeline for buying property in an emerging market
- How do you vet a consultant or local partner?
- How Aesthetic Havens approaches an emerging-market property deal
- Key Takeaways
- Why selective EM property deals make sense right now
- Aesthetic Havens helps you access emerging-market property with less guesswork
- Key sources and further reading
Why invest in emerging markets? The macro evidence for property investors
The GDP-to-market-cap gap is the clearest starting point. Emerging economies contribute roughly 45–46% of global GDP while representing only about 20% of global equity market capitalization. For property investors, that gap matters because real estate values track economic activity more closely than equity prices do. When an economy is underrepresented in capital markets, physical assets often price in the growth before listed securities do.
Emerging markets account for close to 80% of global economic growth and roughly 85% of growth in global consumption, nearly double their share from two decades ago. That consumption growth feeds directly into residential and commercial property demand: more households forming, more retail and logistics space needed, more urban infrastructure required.
Stat to know: EM economies have historically grown at roughly 5–7% annually versus 2–3% for developed markets, a gap that compounds meaningfully over a 10–15 year property hold.
The structural drivers have also shifted. The classic middle-class consumption story has been joined by manufacturing relocations, AI and tech infrastructure build-out, and commodity supply-chain repositioning as equally important growth engines. Semiconductor leadership in parts of EM Asia, commodity cycles in Latin America, and industrial expansion across Southeast Asia each create distinct property demand profiles. Urbanization ties it together: as workers move to cities, demand for housing, logistics, and commercial space follows.
One important caution: GDP growth does not automatically translate into per-share or per-property returns. Share issuance, governance quality, and currency dynamics can disconnect macro growth from investor outcomes. That is why market selection and local expertise matter as much as the macro headline.
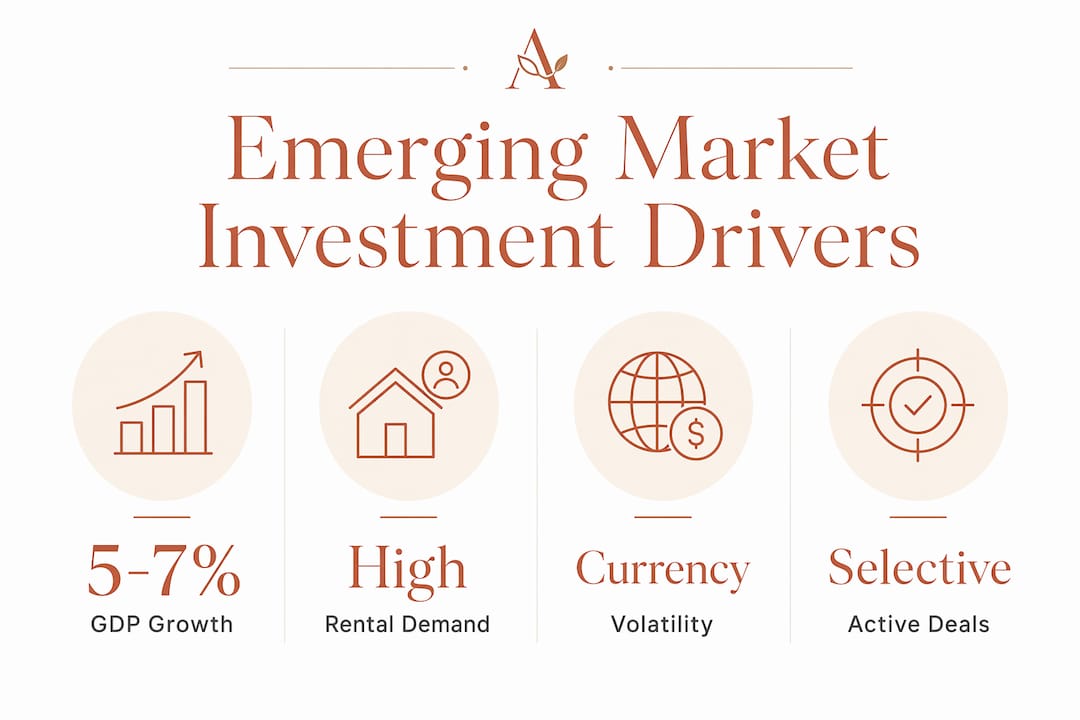
| Driver | Property-relevant impact |
|---|---|
| GDP growth (5–7% EM vs 2–3% DM) | Supports rental demand and capital value appreciation |
| 80% share of global growth | Expands consumer base and commercial space demand |
| Urbanization and infrastructure | Creates new residential and logistics corridors |
| AI and tech infrastructure | Drives demand for data centers, industrial, and mixed-use |
| Commodity cycle strength | Supports income and employment in resource-rich markets |
How does EM property exposure fit your portfolio?

EM property can serve three distinct roles depending on your goals. As a growth engine, it targets markets where GDP and population growth outpace developed-world norms. As an income generator, it captures higher rental yields common in markets where property prices remain below replacement cost. As a diversification sleeve, it adds assets whose price cycles are driven by local demand rather than US Federal Reserve policy.
International property investment tends to have lower correlation with US equities and developed-market real estate during normal periods, which can reduce overall portfolio volatility. That said, correlations tend to rise during global stress events, so EM property should not be treated as a crisis hedge. Test your portfolio for scenarios where EM and developed-market assets move together.
Rough sizing guidance for a property investor:
- 5–10% of total portfolio for a conservative, diversification-focused allocation
- 10–20% for an investor with a long horizon (10+ years), active manager access, and a clear currency plan
- 20%+ only when the investor has on-the-ground presence, local legal relationships, and genuine exit visibility
EM property is a strong fit when you have a long time horizon, a view on local currency direction, access to a vetted local partner, and the ability to hold through a liquidity event without forced selling.
What are the main risks, and how do you manage them?
Every cross-border property deal carries risks that simply do not exist in a domestic transaction. The key ones, and their practical mitigations:
- Political and regulatory risk: Governments can change ownership rules, repatriation limits, or tax treatment with little notice. Mitigate by structuring through jurisdictions with bilateral investment treaties and keeping loan-to-value ratios conservative.
- Currency depreciation: Currency swings can be a larger driver of returns than the local asset price move itself. A property that appreciates 15% in local terms can still produce a negative USD return if the currency falls 20%. Plan in local-currency terms first, then model the USD outcome under stress scenarios.
- Title and legal uncertainty: Many EM jurisdictions have fragmented land registries, informal ownership chains, or restrictions on foreign freehold ownership. Engage a local lawyer independent of the developer, and understand tenure and title structures before signing anything.
- Liquidity constraints: Selling an EM property quickly is rarely possible. Build exit planning into the investment thesis from day one, not as an afterthought.
- Governance and disclosure gaps: Developer track records, financial statements, and planning approvals may be harder to verify. Require audited financials and check completed project references.
Pro Tip: Model your total return in USD (or your home currency) before committing. A currency hedge or local-currency mortgage can dramatically change the risk profile of the same property.
How can you gain EM exposure? Comparing your options
Passive broad-market exposure alone can miss the return dispersion advantages that EM offers. Selective, active approaches tend to harvest more of the available premium, particularly for property investors who can access direct deals.
| Route | Return/growth exposure | Liquidity | Control | Fees & costs | Time horizon |
|---|---|---|---|---|---|
| Direct property | Highest (local appreciation + income) | Very low | Full | 5–10% transaction costs | 7–15 years |
| REITs / REIT ETFs | Moderate (listed, dividend-driven) | High | None | Low (management fees) | 3–7 years |
| Pooled funds | Moderate-high | Low-medium | None | 1–2% annual + carry | 5–10 years |
| Developer JVs | High (development upside) | Very low | Partial | Negotiated | 3–7 years |
| Broad ETFs (VWO, EEM) | Market-rate EM equity | Very high | None | Very low | Any |
The Vanguard FTSE Emerging Markets ETF (VWO) and iShares MSCI Emerging Markets ETF (EEM) offer the lowest-cost, most liquid entry point for investors who want broad EM equity exposure while they build toward a direct property position. For income-focused investors, REITs in property investment offer a middle path between liquidity and real asset exposure.
Direct property and developer JVs carry the highest potential returns but demand the most due diligence, local relationships, and patience. Return dispersion in EM is substantially higher than in developed markets, which means the gap between a well-selected deal and a poorly selected one is far wider than in a US or European transaction.
Practical checklist and timeline for buying property in an emerging market
A cross-border property purchase typically runs 6–18 months from initial market selection to handover, depending on jurisdiction and deal complexity.
- Market shortlist (weeks 1–4): Screen markets by GDP growth trajectory, legal framework for foreign ownership, currency stability, and signs of profitable real estate markets.
- Local partner engagement (weeks 4–8): Identify and vet a local agent, lawyer, and property manager. Confirm their track record with foreign buyers specifically.
- Property-level due diligence (weeks 8–16): Commission an independent title search, structural inspection, planning verification, and developer financial check. Assess land purchase feasibility for development-oriented deals.
- Offer and negotiation (weeks 12–18): Submit a conditional offer with due diligence escape clauses. Negotiate deposit terms and payment milestones.
- Legal and financing (weeks 16–24): Finalize local mortgage or cross-border financing. Complete legal transfer and registration.
- Closing and handover (weeks 24–36): Pay closing costs, register title, and set up property management.
| Cost bucket | Typical range |
|---|---|
| Deposit | 10–30% of purchase price |
| Transaction taxes and stamp duty | 1–8% (varies by jurisdiction) |
| Local agent commission | 1–3% |
| Renovation and permitting | 5–15% (if applicable) |
| Ongoing management fees | 8–12% of annual rent |
For financing, local mortgages are available in many EM markets for foreign buyers but typically require larger down payments (30–40%) and carry higher rates than US domestic loans. Cross-border financing through international banks is slower but may offer better terms for established investors.
How do you vet a consultant or local partner?
The quality of your local partner is often the single biggest determinant of deal outcome in an EM property transaction. A structured vetting process protects you before you commit.
Vetting checklist:
- Verified license or registration in the target jurisdiction
- Documented track record with foreign buyers (ask for completed transaction references)
- On-the-ground presence, not just a website
- Bilingual legal relationships (local lawyer who can explain documents in your language)
- Clear escrow handling procedures
- No undisclosed referral fees from developers
Questions to ask every candidate:
- How many foreign buyers have you transacted with in this market in the past two years?
- Walk me through a recent title complication you resolved. What happened?
- How do you handle repatriation of sale proceeds?
- What is your typical timeline from offer to registration?
- Do you receive any fees from developers or third parties on deals you recommend?
Red flags: Pressure to decide quickly, opaque fee structures, inability to provide verifiable references, and reluctance to introduce you to an independent local lawyer are all reasons to walk away.
How Aesthetic Havens approaches an emerging-market property deal
Aesthetic Havens follows a structured process designed to reduce the risks that most commonly derail cross-border transactions.
- Market shortlist: Identify 2–3 target markets based on the investor’s goals, currency view, and legal framework for foreign ownership.
- Local partner vetting: Screen and qualify local agents, lawyers, and property managers using a documented track record review.
- Deal structuring: Advise on ownership structure, financing options, and deposit protection mechanisms appropriate to the jurisdiction.
- Legal and title coordination: Coordinate independent legal review, title search, and planning verification with local counsel.
- Post-close handover: Introduce the investor to a vetted property manager and establish reporting and repatriation procedures.
Clients working with Aesthetic Havens receive curated market access, reduced transaction risk through pre-vetted local networks, negotiation support grounded in local market knowledge, and documentation and settlement guidance through to closing.
Key Takeaways
A measured, selective allocation to emerging-market property can increase long-term portfolio growth and diversification, provided investors manage currency risk, perform rigorous local due diligence, and plan exit strategies before they commit.
| Point | Details |
|---|---|
| GDP-to-market-cap gap | EM economies represent 45–46% of global GDP but only ~20% of market cap, signaling underpricing. |
| Currency risk is primary | Exchange-rate moves can outweigh local property appreciation; model returns in your home currency first. |
| Active selection beats passive | Return dispersion in EM is high; a vetted local partner and selective deal choice matter more than broad exposure. |
| Due diligence timeline | Budget 6–18 months from market selection to handover, with 5–10% of purchase price in transaction costs. |
| Aesthetic Havens process | Aesthetic Havens provides market shortlisting, local partner vetting, and full transaction coordination for cross-border property deals. |
Why selective EM property deals make sense right now
Most commentary on emerging markets focuses on equities. The property angle is less crowded and, in several markets, more compelling. The same structural drivers that support EM equity earnings, urbanization, infrastructure spending, AI-driven industrial demand, and a weaker US dollar environment, translate directly into physical asset demand. EM hard-currency debt and currencies benefited from policy support and commodity strength, which improves the credit fundamentals that underpin property markets.
What I find underappreciated is how much the risk profile of an EM property deal depends on the quality of the local team rather than the macro story. Investors who get burned usually did so because of a title defect, a developer who ran out of capital, or a currency move they did not model, not because the economy underperformed. The macro case for investing in developing countries is genuinely strong right now. The execution gap is where deals succeed or fail.
Selective, risk-managed deal sourcing, with a vetted local partner and a clear currency plan, is the approach that consistently produces better outcomes than chasing the highest-growth market on a headline GDP number.
Aesthetic Havens helps you access emerging-market property with less guesswork
Cross-border property deals are complex, but the complexity is manageable with the right team. Aesthetic Havens, operating under ERA Realtors, gives property investors direct access to curated emerging-market opportunities, pre-vetted local partners, and end-to-end transaction support from market shortlist to post-close management handover.

Three things Aesthetic Havens does for every cross-border investor: thorough market research and shortlisting, rigorous local partner and developer vetting, and full transaction coordination including legal, title, and settlement support. Whether you are considering your first international property or expanding an existing portfolio, the international real estate investing process starts with a conversation. Reach out to Aesthetic Havens to discuss your target market and investment goals.
Key sources and further reading
- Schroders — Emerging markets overview: Q1 2026 analysis of the GDP-to-market-cap gap and structural EM drivers; used for the macro growth section and regional diversity points.
- UBS — What drives emerging markets?: MSCI EM earnings-growth forecasts and 2025 EM debt/currency performance; used for earnings outlook and macro stability sections.
- VanEck — Investing in emerging markets: Aggregate data on EM share of global growth and consumption; used in the macro drivers and portfolio-fit sections.
- PGIM — Emerging markets pillars of opportunity: Practitioner commentary on return dispersion and the limits of passive exposure; used in the comparative analysis and vetting sections.
- MDPI — Currency risk and international property returns: Academic research on exchange-rate impact on foreign real estate investor returns; used in the risks and currency sections.
- Ryan O’Connell — Emerging markets investing: Explanatory guide covering historical growth rates, GDP-return disconnect, and ETF options (VWO, EEM); used in the macro and comparative sections.
- University of Richmond — “How Large are the Benefits of Emerging Market Equities?”: Academic analysis finding that broad EM indices have Sortino ratios approximately twice those of developed markets, and that Latin American markets are particularly effective at hedging US market downturns.
- Aberdeen Investments — The case for emerging markets today: Practitioner view on the three structural EM drivers (carry, CapEx, cheap valuations) and regional differentiation.
- Costa Rica real estate appreciation trends: Market-specific data on property appreciation in an emerging-market jurisdiction in Central America; useful for regional context.


