

Property market cycles are defined as the recurring sequence of four phases — Recovery, Expansion, Hyper-supply, and Recession — that govern how supply, demand, rents, and prices move over time in any real estate market. Understanding these cycles is the single most useful framework for investors, lenders, and developers making capital allocation decisions. The classic four-phase model runs 7–12 years from trough to trough, though local markets and asset classes can compress or extend that timeline significantly. Whether you are buying your first investment property or managing a diversified portfolio, property market cycles explained correctly will sharpen every decision you make.
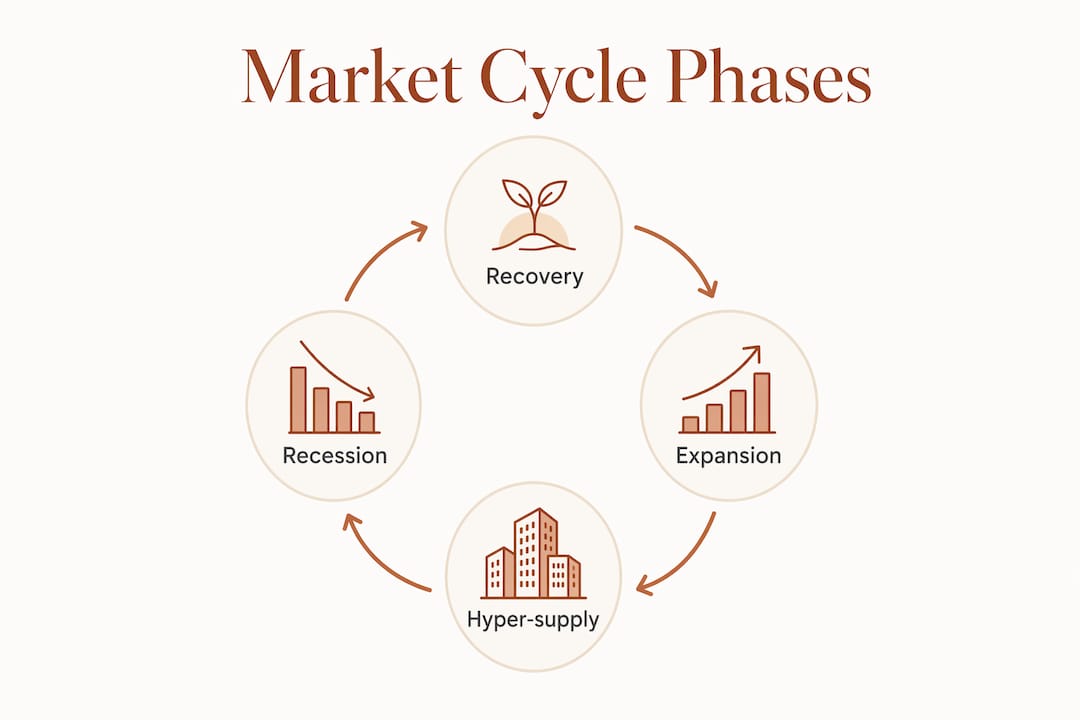
What are the four phases of the property market cycle?
The four-phase cycle gives investors a shared language for describing where a market stands at any given moment. Each phase has distinct characteristics across vacancy rates, rent growth, and construction activity.
| Phase | Vacancy | Rent Growth | Construction |
|---|---|---|---|
| Recovery | High but falling | Flat to slightly positive | Minimal |
| Expansion | Low and declining | Accelerating | Rising starts |
| Hyper-supply | Rising | Slowing or flat | Peak completions |
| Recession | High and rising | Negative | Declining or halted |
Recovery is the phase most investors miss because it looks like the bottom. Occupancy is improving, but rents are still flat and construction is nearly absent. Savvy buyers who enter here capture the full upside of the next phase.
Expansion is where the cycle becomes visible to everyone. Demand outstrips supply, rents accelerate, and developers respond by breaking ground. This phase rewards early movers and punishes those who wait for confirmation.

Hyper-supply is the most dangerous phase to misread. New supply hits the market faster than demand can absorb it. Vacancy rates climb, rent growth stalls, and asset values begin to plateau. The market still looks healthy on the surface because prices lag the underlying shift.
Recession brings high vacancy, falling rents, declining asset values, and tighter lending conditions. Lenders pull back on loan-to-value ratios and shorten loan durations to manage exposure. This phase also plants the seeds of the next Recovery, as construction halts and existing supply gets absorbed.
- Recovery: Buy aggressively where fundamentals support demand.
- Expansion: Hold and refinance to lock in gains.
- Hyper-supply: Reduce leverage and avoid speculative new builds.
- Recession: Preserve capital and prepare for opportunistic acquisitions.
Pro Tip: Never rely on a single phase label for an entire country. Cycle phase must be assessed at the submarket and asset-class level, because a city’s industrial sector can be in Expansion while its office market sits in Recession.
Why does supply always lag demand in real estate?
The supply lag is the structural feature that makes real estate cycles predictable yet still dangerous. Building permits lead completions by months to about a year, which means developers commit to projects based on today’s demand signals but deliver supply into tomorrow’s market conditions.
This timing gap causes a consistent pattern of overshoot. Developers see strong rents and low vacancy in the Expansion phase and respond by starting projects. By the time those projects complete, the market has often already shifted toward Hyper-supply. The market appears strong briefly even while future oversupply is already locked into the pipeline.
Construction timelines vary significantly by property type, which changes the risk profile of each asset class:
- Multifamily and office buildings typically take 18–36 months from groundbreaking to completion.
- Industrial properties deliver faster, usually within 12–18 months.
- Specialized assets like trophy office towers can take up to 60 months from permit to occupancy.
The 2008 housing crisis is the clearest modern example of supply overshoot. In 2004, 1.83 million units were completed against only 1.35 million new households, a gap that contributed directly to the oversupply that preceded the crash. The lesson is not that developers acted irrationally. They acted on the data available to them. The lesson is that investors must look forward at the supply pipeline, not backward at current rents.
Pro Tip: Track building permits in your target submarket every quarter. A sudden spike in permits today signals a supply wave 12–36 months out, depending on asset class. Adjust your underwriting assumptions before that supply hits.
What indicators identify the current cycle phase?
Identifying where a market sits in the cycle requires reading multiple signals simultaneously. No single metric tells the full story. The most reliable indicators are vacancy rates, rent growth trends, construction pipeline data, and transaction volumes.
Vacancy rates are the best real-time signal of supply and demand balance. U.S. rental vacancy sat at 6.8% in 2024, with homeownership vacancy near 0.95%. Low vacancy confirms absorption is outpacing supply, which aligns with Expansion. Rising vacancy signals the market is tipping toward Hyper-supply.
Rent growth trends confirm what vacancy rates suggest. Accelerating rent growth in a low-vacancy environment confirms Expansion. Decelerating rent growth despite low vacancy is an early warning that Hyper-supply is approaching.
Construction pipeline data is the forward-looking tool that separates informed investors from reactive ones. Permits, starts, and completions each tell a different part of the story. Permits show developer intent. Starts show committed capital. Completions show when supply actually hits the market.
Transaction volumes and price trends round out the picture, but with an important caveat. Home prices lag transaction volume in real estate cycles. Prices peaked more than two years after new sales peaked in the 2005 housing market. Waiting for price drops to confirm a downturn means you are already late.
- Check vacancy rates for your target submarket and asset class.
- Track rent growth on a quarterly basis, not annually.
- Pull permit and completion data from local planning authorities or CoStar.
- Monitor transaction volumes as an early-warning signal ahead of price moves.
- Cross-reference all four indicators before drawing a cycle phase conclusion.
The cycle phase is best treated as a probability, not a definitive label. Two analysts looking at the same market can reasonably disagree on whether it is late Expansion or early Hyper-supply. That uncertainty is why using a combination of indicators matters more than finding the perfect single metric.
How do property investment cycles shape strategy and risk management?
Understanding the cycle phase changes how you structure every deal. The goal is not to perfectly time the market. The goal is to size your risk correctly for where the market is most likely heading.
In Recovery, the best strategy is opportunistic buying with a long hold horizon. Prices are depressed, competition is low, and the risk of further downside is limited if you have selected markets with strong demand fundamentals like job growth, population inflow, and constrained supply. This is where conservative LTV ratios and flexible loan terms protect you if the recovery takes longer than expected.
In Expansion, the priority shifts to holding quality assets and refinancing to lock in favorable terms. New acquisitions require more discipline because competition drives prices up and compresses yields. Geographic diversification becomes more valuable here, because not all markets enter Expansion simultaneously.
In Hyper-supply, the most common mistake is confusing a still-rising price with a healthy market. Interest rate tightening hits transaction volumes quickly but prices lag, so early signs of a downturn appear in sales and permits, not in the price data most investors watch. Reduce leverage, avoid speculative development, and shorten loan durations.
In Recession, capital preservation is the primary objective. Lenders and equity investors prioritize different metrics during this phase. Lenders focus on loan duration and LTV. Equity investors focus on operating cash flow and vacancy trends. Both groups are managing downside risk rather than chasing upside. For investors with dry powder, Recession is also the setup phase for the next Recovery entry.
Pro Tip: For international diversification, check out why international property investment can reduce your exposure to a single market’s cycle timing.
What are 2026 market signals telling us about the current cycle?
Current U.S. data presents a mixed picture that illustrates exactly why reading multiple indicators matters. As of may 2026, listing prices fell 2.4% year over year for seven consecutive months while pending sales rose 4.3% year over year. Falling prices alongside rising contract activity suggests softening rather than a deep Recession. Demand is still present; it is price discovery that is adjusting.
Vacancy rates remain near historic lows, which keeps the market from fitting a clean Recession label. At the same time, the U.S. in 2024 recorded 4.3 permits per 1,000 people against 4.8 completions per 1,000 people, a signal that the pipeline is thinning. Fewer permits today mean less supply pressure 12–24 months from now, which could support a return to tighter vacancy conditions.
For Singapore investors, the 2025–2026 property market forecast shows its own cycle dynamics shaped by local demand drivers, government cooling measures, and constrained land supply. These local factors mean Singapore’s cycle phase does not mirror the U.S. trajectory.
The collective signal from 2026 data points to a market in transition, likely between late Expansion and early Hyper-supply in many U.S. submarkets, with significant variation by city and asset class. That is exactly the environment where cycle awareness separates disciplined investors from reactive ones.
Key takeaways
The most reliable way to navigate property market cycles is to track vacancy rates, rent growth, construction pipelines, and transaction volumes together rather than relying on price signals alone.
| Point | Details |
|---|---|
| Four-phase cycle framework | Recovery, Expansion, Hyper-supply, and Recession each require a different investment strategy. |
| Supply lag creates risk | Permits lead completions by up to a year, causing developers to overshoot demand regularly. |
| Price signals lag reality | Transaction volumes and permits fall months before prices drop, so watch leading indicators first. |
| Cycle phase is local | Assess each submarket and asset class separately rather than applying a national label. |
| 2026 signals are mixed | Falling U.S. listing prices alongside rising pending sales point to softening, not a full Recession. |
What i’ve learned from watching cycles play out in real time
Most investors I work with come in focused on one number: price. They want to know if prices are going up or down. I understand the instinct, but price is the last thing to move in a real estate cycle. By the time prices confirm what you suspected, the opportunity has already passed or the risk has already materialized.
The investors who consistently make good decisions are the ones tracking vacancy trends in their specific submarket, watching permit data quarterly, and paying attention to transaction volumes. These are not glamorous metrics. They do not make headlines. But they tell you where the market is heading, not where it has been.
The other thing I have seen repeatedly is investors applying a national cycle label to a local decision. The U.S. housing market is not one market. Singapore’s private residential sector is not one market either. The Singapore rental market in 2025 showed vacancy and rent dynamics that differed sharply between districts and property types. Cycle analysis only works when it is specific.
My honest advice for 2026: treat the current environment as late-cycle until the data tells you otherwise. That means conservative leverage, shorter loan durations, and a preference for assets with strong income fundamentals over speculative plays. The cycle will turn. It always does. The question is whether your portfolio is positioned to survive the turn and capitalize on what comes next.
— Aman
How aesthetic havens helps you navigate every phase of the cycle
Knowing the theory is one thing. Applying it to a real acquisition decision in a specific submarket requires current data, local expertise, and a clear-eyed view of your own risk tolerance.

Aesthetic Havens provides real estate advisory services designed specifically for investors who want cycle-informed guidance, not generic market commentary. From reading vacancy and pipeline data in Singapore’s residential and commercial sectors to structuring deals that match your phase-specific strategy, the team at Aesthetic Havens brings the analytical depth you need. For investors looking to select investment property with maximum return potential, professional advisory support is the difference between reacting to the cycle and staying ahead of it.
FAQ
What are the four phases of the property market cycle?
The four phases are Recovery, Expansion, Hyper-supply, and Recession. Each phase is defined by distinct patterns in vacancy rates, rent growth, construction activity, and asset values.
How long does a full property market cycle typically last?
A full cycle runs 7–12 years from trough to trough, though local markets and specific asset classes can move faster or slower depending on demand drivers and supply constraints.
Why do prices lag other cycle indicators?
Prices are a lagging indicator because sellers resist cutting asking prices even as transaction volumes fall. The 2005 housing market showed prices peaking more than two years after new sales peaked, confirming that volume and permits move first.
What is the best single indicator for identifying cycle phase?
Vacancy rates are the most reliable real-time indicator. Low and falling vacancy confirms absorption is outpacing supply, while rising vacancy signals the market is shifting toward Hyper-supply or Recession.
How should investment strategy change across cycle phases?
Recovery favors opportunistic buying with conservative leverage. Expansion rewards holding and refinancing. Hyper-supply calls for reducing debt and avoiding speculative development. Recession prioritizes capital preservation and preparation for the next Recovery entry.
Recommended
- Singapore Property Market: Navigating the Transition – A Definitive Forecast for 2025-2026 | Aesthetic Havens
- 2026 housing market forecast: Why January Is the Strategic Month to Buy | Aesthetic Havens
- The 2026 HDB MOP Wave: Impact on Private Property Prices | Aesthetic Havens
- Singapore HDB Resale Market Deep Dive (H2 2025): Top Estates & Price Forecasts | Aesthetic Havens
